Fijian vs Immigrants from Trinidad and Tobago 10th Grade
COMPARE
Fijian
Immigrants from Trinidad and Tobago
10th Grade
10th Grade Comparison
Fijians
Immigrants from Trinidad and Tobago
91.5%
10TH GRADE
0.0/ 100
METRIC RATING
297th/ 347
METRIC RANK
92.3%
10TH GRADE
0.1/ 100
METRIC RATING
276th/ 347
METRIC RANK
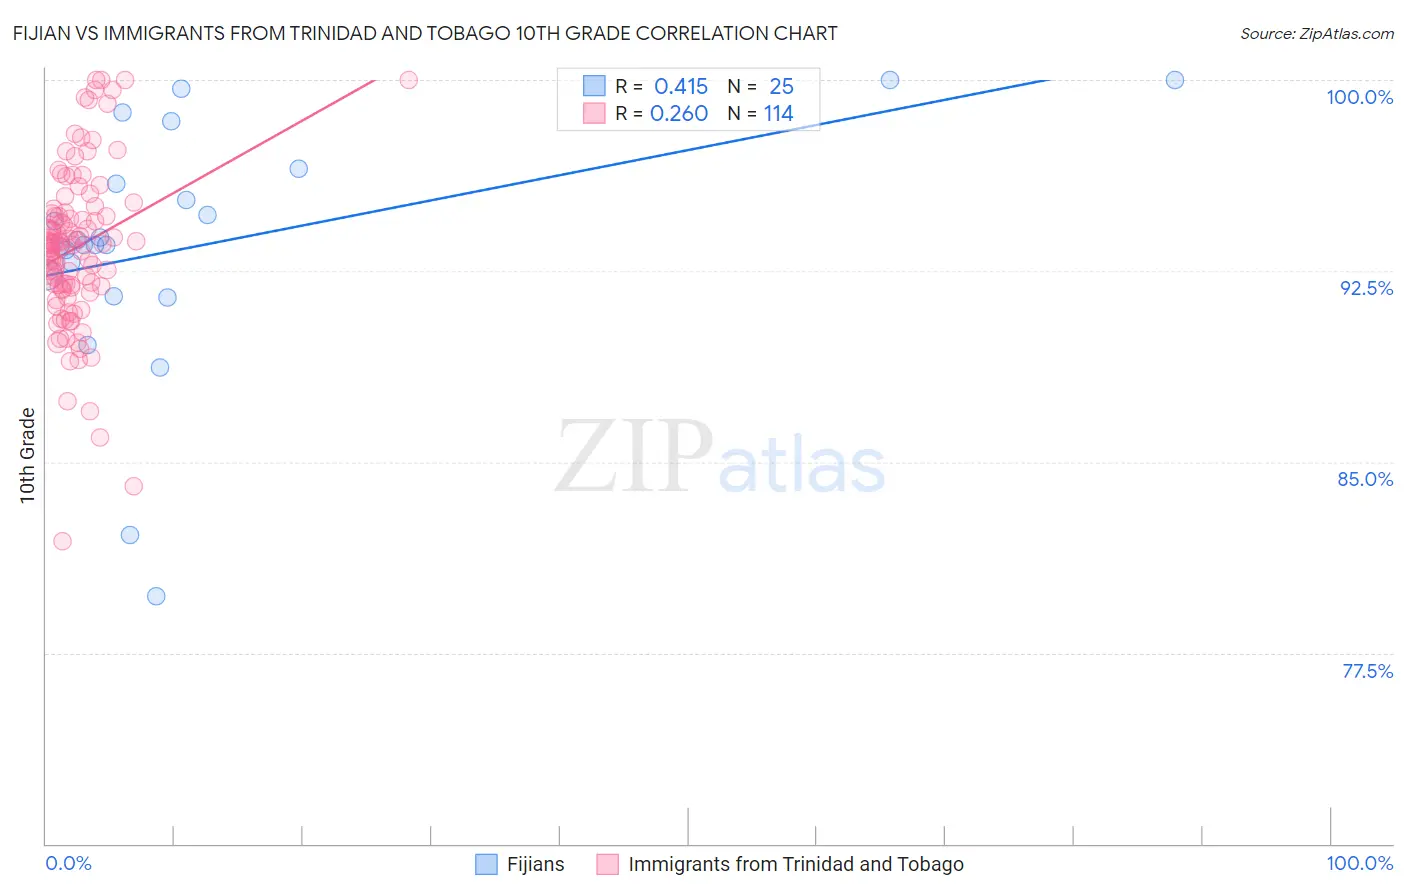
Fijian vs Immigrants from Trinidad and Tobago 10th Grade Correlation Chart
The statistical analysis conducted on geographies consisting of 55,948,842 people shows a moderate positive correlation between the proportion of Fijians and percentage of population with at least 10th grade education in the United States with a correlation coefficient (R) of 0.415 and weighted average of 91.5%. Similarly, the statistical analysis conducted on geographies consisting of 223,526,834 people shows a weak positive correlation between the proportion of Immigrants from Trinidad and Tobago and percentage of population with at least 10th grade education in the United States with a correlation coefficient (R) of 0.260 and weighted average of 92.3%, a difference of 0.90%.
10th Grade Correlation Summary
| Measurement | Fijian | Immigrants from Trinidad and Tobago |
| Minimum | 79.7% | 81.9% |
| Maximum | 100.0% | 100.0% |
| Range | 20.3% | 18.1% |
| Mean | 93.5% | 93.4% |
| Median | 93.5% | 93.6% |
| Interquartile 25% (IQ1) | 91.9% | 91.8% |
| Interquartile 75% (IQ3) | 96.2% | 94.8% |
| Interquartile Range (IQR) | 4.3% | 3.0% |
| Standard Deviation (Sample) | 4.8% | 3.2% |
| Standard Deviation (Population) | 4.7% | 3.2% |
Similar Demographics by 10th Grade
Demographics Similar to Fijians by 10th Grade
In terms of 10th grade, the demographic groups most similar to Fijians are Cuban (91.5%, a difference of 0.020%), Immigrants from Haiti (91.4%, a difference of 0.10%), Immigrants from Grenada (91.6%, a difference of 0.14%), Guyanese (91.4%, a difference of 0.15%), and Lumbee (91.7%, a difference of 0.27%).
| Demographics | Rating | Rank | 10th Grade |
| British West Indians | 0.0 /100 | #290 | Tragic 91.8% |
| Immigrants | West Indies | 0.0 /100 | #291 | Tragic 91.8% |
| Immigrants | Burma/Myanmar | 0.0 /100 | #292 | Tragic 91.8% |
| Indonesians | 0.0 /100 | #293 | Tragic 91.8% |
| Haitians | 0.0 /100 | #294 | Tragic 91.8% |
| Lumbee | 0.0 /100 | #295 | Tragic 91.7% |
| Immigrants | Grenada | 0.0 /100 | #296 | Tragic 91.6% |
| Fijians | 0.0 /100 | #297 | Tragic 91.5% |
| Cubans | 0.0 /100 | #298 | Tragic 91.5% |
| Immigrants | Haiti | 0.0 /100 | #299 | Tragic 91.4% |
| Guyanese | 0.0 /100 | #300 | Tragic 91.4% |
| Japanese | 0.0 /100 | #301 | Tragic 91.2% |
| Immigrants | Guyana | 0.0 /100 | #302 | Tragic 91.2% |
| Immigrants | Vietnam | 0.0 /100 | #303 | Tragic 91.2% |
| Pima | 0.0 /100 | #304 | Tragic 91.2% |
Demographics Similar to Immigrants from Trinidad and Tobago by 10th Grade
In terms of 10th grade, the demographic groups most similar to Immigrants from Trinidad and Tobago are Navajo (92.3%, a difference of 0.070%), Barbadian (92.2%, a difference of 0.11%), West Indian (92.4%, a difference of 0.12%), Native/Alaskan (92.2%, a difference of 0.12%), and Trinidadian and Tobagonian (92.4%, a difference of 0.13%).
| Demographics | Rating | Rank | 10th Grade |
| Immigrants | Colombia | 0.3 /100 | #269 | Tragic 92.5% |
| Immigrants | Uruguay | 0.3 /100 | #270 | Tragic 92.5% |
| Immigrants | Eritrea | 0.3 /100 | #271 | Tragic 92.5% |
| Immigrants | Western Africa | 0.3 /100 | #272 | Tragic 92.5% |
| Trinidadians and Tobagonians | 0.2 /100 | #273 | Tragic 92.4% |
| Immigrants | Congo | 0.2 /100 | #274 | Tragic 92.4% |
| West Indians | 0.2 /100 | #275 | Tragic 92.4% |
| Immigrants | Trinidad and Tobago | 0.1 /100 | #276 | Tragic 92.3% |
| Navajo | 0.1 /100 | #277 | Tragic 92.3% |
| Barbadians | 0.1 /100 | #278 | Tragic 92.2% |
| Natives/Alaskans | 0.1 /100 | #279 | Tragic 92.2% |
| Malaysians | 0.1 /100 | #280 | Tragic 92.2% |
| Bangladeshis | 0.1 /100 | #281 | Tragic 92.2% |
| Immigrants | Peru | 0.1 /100 | #282 | Tragic 92.2% |
| Immigrants | St. Vincent and the Grenadines | 0.0 /100 | #283 | Tragic 92.1% |