Fijian vs West Indian Doctorate Degree
COMPARE
Fijian
West Indian
Doctorate Degree
Doctorate Degree Comparison
Fijians
West Indians
1.1%
DOCTORATE DEGREE
0.0/ 100
METRIC RATING
343rd/ 347
METRIC RANK
1.6%
DOCTORATE DEGREE
2.5/ 100
METRIC RATING
239th/ 347
METRIC RANK
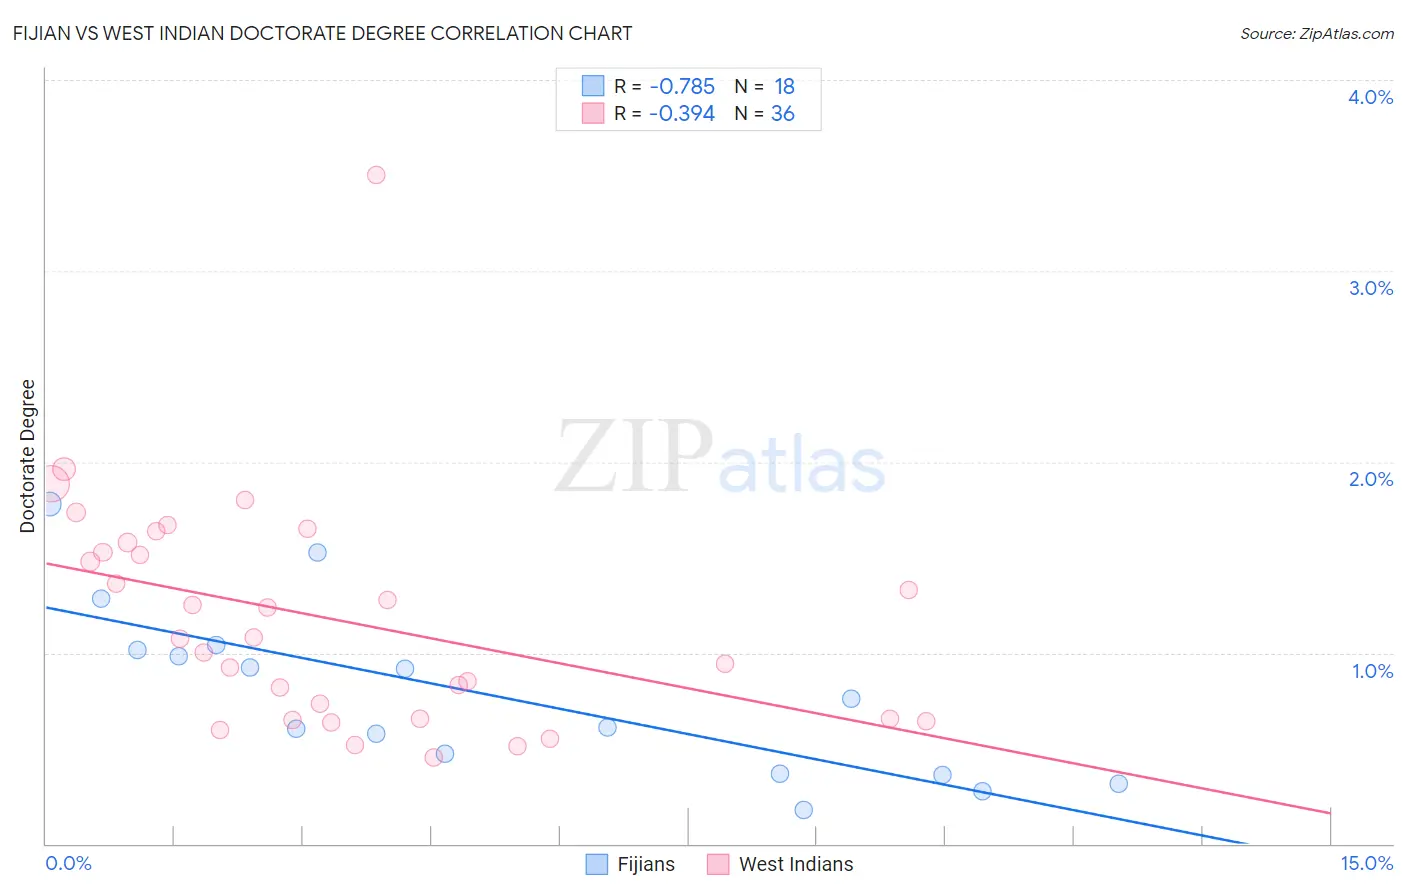
Fijian vs West Indian Doctorate Degree Correlation Chart
The statistical analysis conducted on geographies consisting of 55,685,158 people shows a strong negative correlation between the proportion of Fijians and percentage of population with at least doctorate degree education in the United States with a correlation coefficient (R) of -0.785 and weighted average of 1.1%. Similarly, the statistical analysis conducted on geographies consisting of 252,865,047 people shows a mild negative correlation between the proportion of West Indians and percentage of population with at least doctorate degree education in the United States with a correlation coefficient (R) of -0.394 and weighted average of 1.6%, a difference of 41.1%.
Doctorate Degree Correlation Summary
| Measurement | Fijian | West Indian |
| Minimum | 0.18% | 0.45% |
| Maximum | 1.8% | 3.5% |
| Range | 1.6% | 3.0% |
| Mean | 0.78% | 1.2% |
| Median | 0.68% | 1.1% |
| Interquartile 25% (IQ1) | 0.37% | 0.65% |
| Interquartile 75% (IQ3) | 1.0% | 1.6% |
| Interquartile Range (IQR) | 0.64% | 0.90% |
| Standard Deviation (Sample) | 0.45% | 0.60% |
| Standard Deviation (Population) | 0.43% | 0.59% |
Similar Demographics by Doctorate Degree
Demographics Similar to Fijians by Doctorate Degree
In terms of doctorate degree, the demographic groups most similar to Fijians are Immigrants from Mexico (1.1%, a difference of 2.1%), Arapaho (1.2%, a difference of 3.4%), Lumbee (1.1%, a difference of 3.6%), Mexican (1.2%, a difference of 3.8%), and Immigrants from Cuba (1.2%, a difference of 4.3%).
| Demographics | Rating | Rank | Doctorate Degree |
| Immigrants | Caribbean | 0.0 /100 | #333 | Tragic 1.3% |
| Immigrants | Dominican Republic | 0.0 /100 | #334 | Tragic 1.3% |
| Immigrants | Haiti | 0.0 /100 | #335 | Tragic 1.3% |
| Nepalese | 0.0 /100 | #336 | Tragic 1.3% |
| Bangladeshis | 0.0 /100 | #337 | Tragic 1.2% |
| Puget Sound Salish | 0.0 /100 | #338 | Tragic 1.2% |
| Immigrants | Central America | 0.0 /100 | #339 | Tragic 1.2% |
| Immigrants | Cuba | 0.0 /100 | #340 | Tragic 1.2% |
| Mexicans | 0.0 /100 | #341 | Tragic 1.2% |
| Arapaho | 0.0 /100 | #342 | Tragic 1.2% |
| Fijians | 0.0 /100 | #343 | Tragic 1.1% |
| Immigrants | Mexico | 0.0 /100 | #344 | Tragic 1.1% |
| Lumbee | 0.0 /100 | #345 | Tragic 1.1% |
| Spanish American Indians | 0.0 /100 | #346 | Tragic 1.1% |
| Houma | 0.0 /100 | #347 | Tragic 0.96% |
Demographics Similar to West Indians by Doctorate Degree
In terms of doctorate degree, the demographic groups most similar to West Indians are Immigrants from Congo (1.6%, a difference of 0.10%), Immigrants from Panama (1.6%, a difference of 0.19%), Iroquois (1.6%, a difference of 0.31%), Cheyenne (1.6%, a difference of 0.38%), and Indonesian (1.6%, a difference of 0.50%).
| Demographics | Rating | Rank | Doctorate Degree |
| Guamanians/Chamorros | 3.3 /100 | #232 | Tragic 1.6% |
| Barbadians | 3.3 /100 | #233 | Tragic 1.6% |
| Hopi | 3.2 /100 | #234 | Tragic 1.6% |
| Cree | 3.0 /100 | #235 | Tragic 1.6% |
| Indonesians | 2.8 /100 | #236 | Tragic 1.6% |
| Iroquois | 2.7 /100 | #237 | Tragic 1.6% |
| Immigrants | Congo | 2.6 /100 | #238 | Tragic 1.6% |
| West Indians | 2.5 /100 | #239 | Tragic 1.6% |
| Immigrants | Panama | 2.4 /100 | #240 | Tragic 1.6% |
| Cheyenne | 2.3 /100 | #241 | Tragic 1.6% |
| Ottawa | 2.2 /100 | #242 | Tragic 1.6% |
| Native Hawaiians | 2.1 /100 | #243 | Tragic 1.6% |
| French American Indians | 2.0 /100 | #244 | Tragic 1.6% |
| Delaware | 1.9 /100 | #245 | Tragic 1.6% |
| Hmong | 1.8 /100 | #246 | Tragic 1.6% |