Israeli vs Immigrants from Trinidad and Tobago Doctorate Degree
COMPARE
Israeli
Immigrants from Trinidad and Tobago
Doctorate Degree
Doctorate Degree Comparison
Israelis
Immigrants from Trinidad and Tobago
2.7%
DOCTORATE DEGREE
100.0/ 100
METRIC RATING
24th/ 347
METRIC RANK
1.5%
DOCTORATE DEGREE
0.5/ 100
METRIC RATING
271st/ 347
METRIC RANK
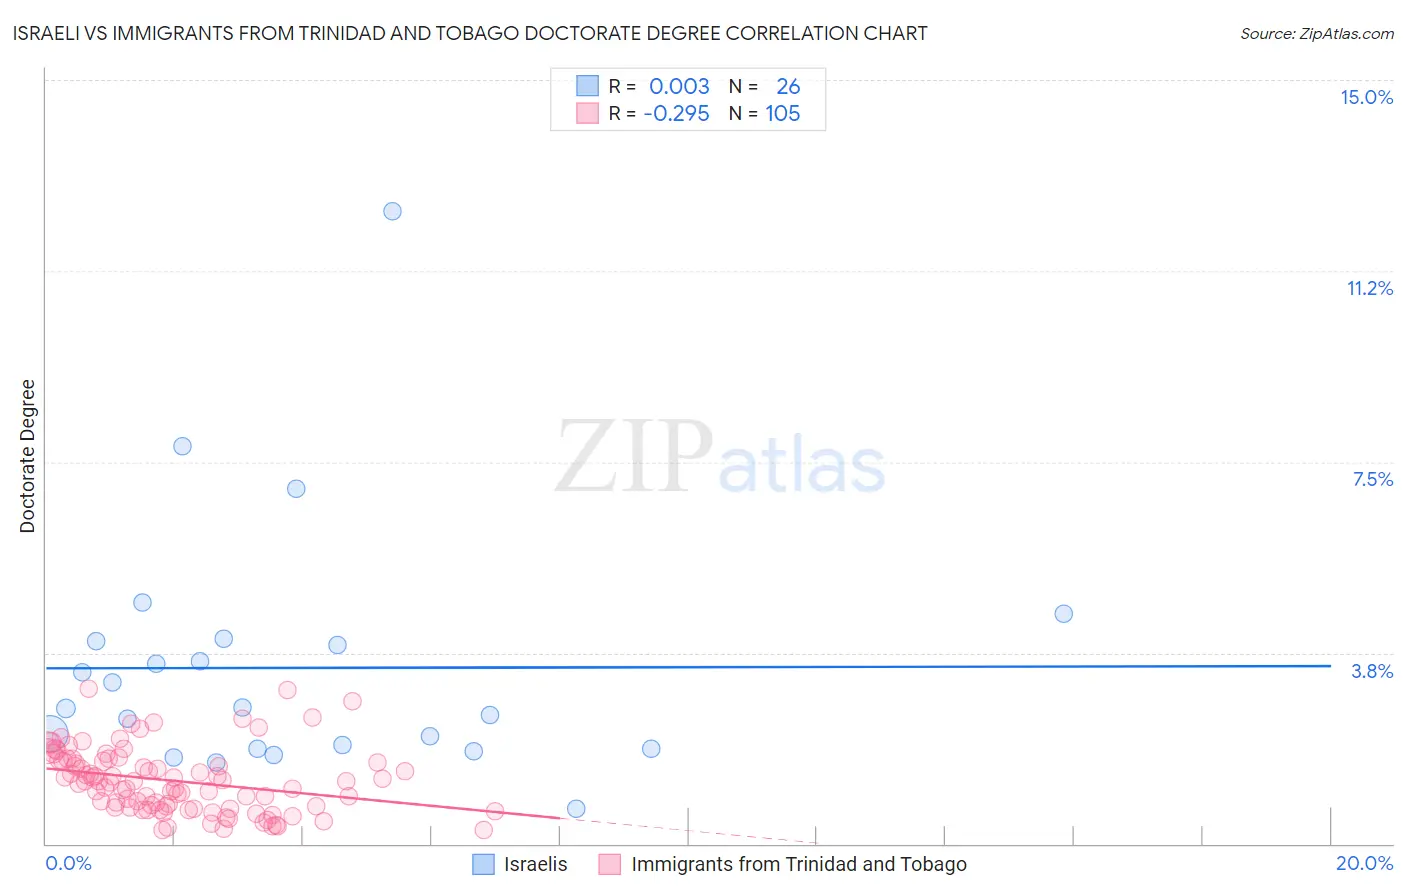
Israeli vs Immigrants from Trinidad and Tobago Doctorate Degree Correlation Chart
The statistical analysis conducted on geographies consisting of 210,422,088 people shows no correlation between the proportion of Israelis and percentage of population with at least doctorate degree education in the United States with a correlation coefficient (R) of 0.003 and weighted average of 2.7%. Similarly, the statistical analysis conducted on geographies consisting of 222,674,417 people shows a weak negative correlation between the proportion of Immigrants from Trinidad and Tobago and percentage of population with at least doctorate degree education in the United States with a correlation coefficient (R) of -0.295 and weighted average of 1.5%, a difference of 84.3%.
Doctorate Degree Correlation Summary
| Measurement | Israeli | Immigrants from Trinidad and Tobago |
| Minimum | 0.70% | 0.28% |
| Maximum | 12.4% | 3.0% |
| Range | 11.7% | 2.8% |
| Mean | 3.5% | 1.2% |
| Median | 2.7% | 1.2% |
| Interquartile 25% (IQ1) | 1.9% | 0.71% |
| Interquartile 75% (IQ3) | 4.0% | 1.6% |
| Interquartile Range (IQR) | 2.1% | 0.93% |
| Standard Deviation (Sample) | 2.4% | 0.63% |
| Standard Deviation (Population) | 2.4% | 0.63% |
Similar Demographics by Doctorate Degree
Demographics Similar to Israelis by Doctorate Degree
In terms of doctorate degree, the demographic groups most similar to Israelis are Immigrants from Denmark (2.8%, a difference of 1.3%), Mongolian (2.8%, a difference of 1.4%), Immigrants from Saudi Arabia (2.7%, a difference of 1.5%), Thai (2.8%, a difference of 1.6%), and Immigrants from Hong Kong (2.8%, a difference of 2.0%).
| Demographics | Rating | Rank | Doctorate Degree |
| Immigrants | Australia | 100.0 /100 | #17 | Exceptional 2.8% |
| Immigrants | Sri Lanka | 100.0 /100 | #18 | Exceptional 2.8% |
| Immigrants | Japan | 100.0 /100 | #19 | Exceptional 2.8% |
| Immigrants | Hong Kong | 100.0 /100 | #20 | Exceptional 2.8% |
| Thais | 100.0 /100 | #21 | Exceptional 2.8% |
| Mongolians | 100.0 /100 | #22 | Exceptional 2.8% |
| Immigrants | Denmark | 100.0 /100 | #23 | Exceptional 2.8% |
| Israelis | 100.0 /100 | #24 | Exceptional 2.7% |
| Immigrants | Saudi Arabia | 100.0 /100 | #25 | Exceptional 2.7% |
| Turks | 100.0 /100 | #26 | Exceptional 2.7% |
| Immigrants | Turkey | 100.0 /100 | #27 | Exceptional 2.6% |
| Burmese | 100.0 /100 | #28 | Exceptional 2.6% |
| Immigrants | South Central Asia | 100.0 /100 | #29 | Exceptional 2.6% |
| Immigrants | Korea | 100.0 /100 | #30 | Exceptional 2.6% |
| Latvians | 100.0 /100 | #31 | Exceptional 2.6% |
Demographics Similar to Immigrants from Trinidad and Tobago by Doctorate Degree
In terms of doctorate degree, the demographic groups most similar to Immigrants from Trinidad and Tobago are Salvadoran (1.5%, a difference of 0.070%), Immigrants from Barbados (1.5%, a difference of 0.090%), Crow (1.5%, a difference of 0.10%), Kiowa (1.5%, a difference of 0.19%), and U.S. Virgin Islander (1.5%, a difference of 0.19%).
| Demographics | Rating | Rank | Doctorate Degree |
| Blackfeet | 0.7 /100 | #264 | Tragic 1.5% |
| Nicaraguans | 0.6 /100 | #265 | Tragic 1.5% |
| Immigrants | Liberia | 0.5 /100 | #266 | Tragic 1.5% |
| Kiowa | 0.5 /100 | #267 | Tragic 1.5% |
| U.S. Virgin Islanders | 0.5 /100 | #268 | Tragic 1.5% |
| Crow | 0.5 /100 | #269 | Tragic 1.5% |
| Salvadorans | 0.5 /100 | #270 | Tragic 1.5% |
| Immigrants | Trinidad and Tobago | 0.5 /100 | #271 | Tragic 1.5% |
| Immigrants | Barbados | 0.4 /100 | #272 | Tragic 1.5% |
| Sioux | 0.4 /100 | #273 | Tragic 1.5% |
| Yaqui | 0.4 /100 | #274 | Tragic 1.5% |
| Aleuts | 0.4 /100 | #275 | Tragic 1.5% |
| Paiute | 0.4 /100 | #276 | Tragic 1.5% |
| Bahamians | 0.4 /100 | #277 | Tragic 1.5% |
| Hawaiians | 0.4 /100 | #278 | Tragic 1.5% |