White/Caucasian vs Immigrants from Trinidad and Tobago Doctorate Degree
COMPARE
White/Caucasian
Immigrants from Trinidad and Tobago
Doctorate Degree
Doctorate Degree Comparison
Whites/Caucasians
Immigrants from Trinidad and Tobago
1.8%
DOCTORATE DEGREE
22.8/ 100
METRIC RATING
200th/ 347
METRIC RANK
1.5%
DOCTORATE DEGREE
0.5/ 100
METRIC RATING
271st/ 347
METRIC RANK
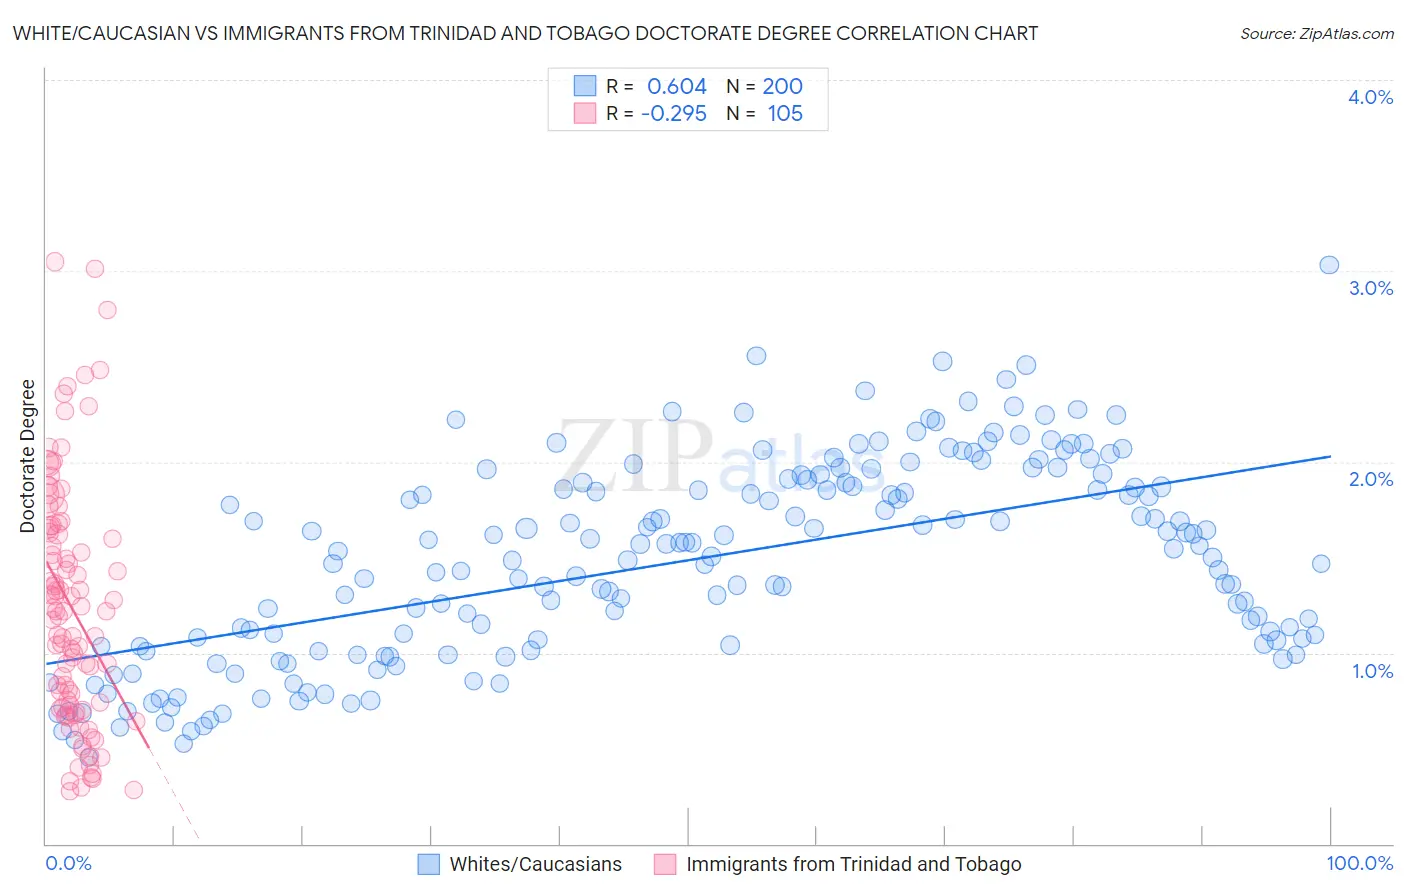
White/Caucasian vs Immigrants from Trinidad and Tobago Doctorate Degree Correlation Chart
The statistical analysis conducted on geographies consisting of 553,713,140 people shows a significant positive correlation between the proportion of Whites/Caucasians and percentage of population with at least doctorate degree education in the United States with a correlation coefficient (R) of 0.604 and weighted average of 1.8%. Similarly, the statistical analysis conducted on geographies consisting of 222,674,417 people shows a weak negative correlation between the proportion of Immigrants from Trinidad and Tobago and percentage of population with at least doctorate degree education in the United States with a correlation coefficient (R) of -0.295 and weighted average of 1.5%, a difference of 19.0%.
Doctorate Degree Correlation Summary
| Measurement | White/Caucasian | Immigrants from Trinidad and Tobago |
| Minimum | 0.45% | 0.28% |
| Maximum | 3.0% | 3.0% |
| Range | 2.6% | 2.8% |
| Mean | 1.5% | 1.2% |
| Median | 1.5% | 1.2% |
| Interquartile 25% (IQ1) | 1.0% | 0.71% |
| Interquartile 75% (IQ3) | 1.9% | 1.6% |
| Interquartile Range (IQR) | 0.85% | 0.93% |
| Standard Deviation (Sample) | 0.52% | 0.63% |
| Standard Deviation (Population) | 0.52% | 0.63% |
Similar Demographics by Doctorate Degree
Demographics Similar to Whites/Caucasians by Doctorate Degree
In terms of doctorate degree, the demographic groups most similar to Whites/Caucasians are Immigrants from Nigeria (1.8%, a difference of 0.070%), Immigrants from South America (1.8%, a difference of 0.11%), Portuguese (1.8%, a difference of 0.29%), Immigrants from Vietnam (1.8%, a difference of 0.32%), and Somali (1.7%, a difference of 0.35%).
| Demographics | Rating | Rank | Doctorate Degree |
| German Russians | 27.1 /100 | #193 | Fair 1.8% |
| Uruguayans | 26.2 /100 | #194 | Fair 1.8% |
| Immigrants | Somalia | 25.4 /100 | #195 | Fair 1.8% |
| Sub-Saharan Africans | 25.1 /100 | #196 | Fair 1.8% |
| Chinese | 25.1 /100 | #197 | Fair 1.8% |
| Immigrants | Ghana | 24.6 /100 | #198 | Fair 1.8% |
| Immigrants | South America | 23.3 /100 | #199 | Fair 1.8% |
| Whites/Caucasians | 22.8 /100 | #200 | Fair 1.8% |
| Immigrants | Nigeria | 22.4 /100 | #201 | Fair 1.8% |
| Portuguese | 21.4 /100 | #202 | Fair 1.8% |
| Immigrants | Vietnam | 21.4 /100 | #203 | Fair 1.8% |
| Somalis | 21.2 /100 | #204 | Fair 1.7% |
| Venezuelans | 19.5 /100 | #205 | Poor 1.7% |
| Immigrants | Peru | 17.6 /100 | #206 | Poor 1.7% |
| Yugoslavians | 17.1 /100 | #207 | Poor 1.7% |
Demographics Similar to Immigrants from Trinidad and Tobago by Doctorate Degree
In terms of doctorate degree, the demographic groups most similar to Immigrants from Trinidad and Tobago are Salvadoran (1.5%, a difference of 0.070%), Immigrants from Barbados (1.5%, a difference of 0.090%), Crow (1.5%, a difference of 0.10%), Kiowa (1.5%, a difference of 0.19%), and U.S. Virgin Islander (1.5%, a difference of 0.19%).
| Demographics | Rating | Rank | Doctorate Degree |
| Blackfeet | 0.7 /100 | #264 | Tragic 1.5% |
| Nicaraguans | 0.6 /100 | #265 | Tragic 1.5% |
| Immigrants | Liberia | 0.5 /100 | #266 | Tragic 1.5% |
| Kiowa | 0.5 /100 | #267 | Tragic 1.5% |
| U.S. Virgin Islanders | 0.5 /100 | #268 | Tragic 1.5% |
| Crow | 0.5 /100 | #269 | Tragic 1.5% |
| Salvadorans | 0.5 /100 | #270 | Tragic 1.5% |
| Immigrants | Trinidad and Tobago | 0.5 /100 | #271 | Tragic 1.5% |
| Immigrants | Barbados | 0.4 /100 | #272 | Tragic 1.5% |
| Sioux | 0.4 /100 | #273 | Tragic 1.5% |
| Yaqui | 0.4 /100 | #274 | Tragic 1.5% |
| Aleuts | 0.4 /100 | #275 | Tragic 1.5% |
| Paiute | 0.4 /100 | #276 | Tragic 1.5% |
| Bahamians | 0.4 /100 | #277 | Tragic 1.5% |
| Hawaiians | 0.4 /100 | #278 | Tragic 1.5% |