African vs Immigrants from Trinidad and Tobago Doctorate Degree
COMPARE
African
Immigrants from Trinidad and Tobago
Doctorate Degree
Doctorate Degree Comparison
Africans
Immigrants from Trinidad and Tobago
1.6%
DOCTORATE DEGREE
1.8/ 100
METRIC RATING
248th/ 347
METRIC RANK
1.5%
DOCTORATE DEGREE
0.5/ 100
METRIC RATING
271st/ 347
METRIC RANK
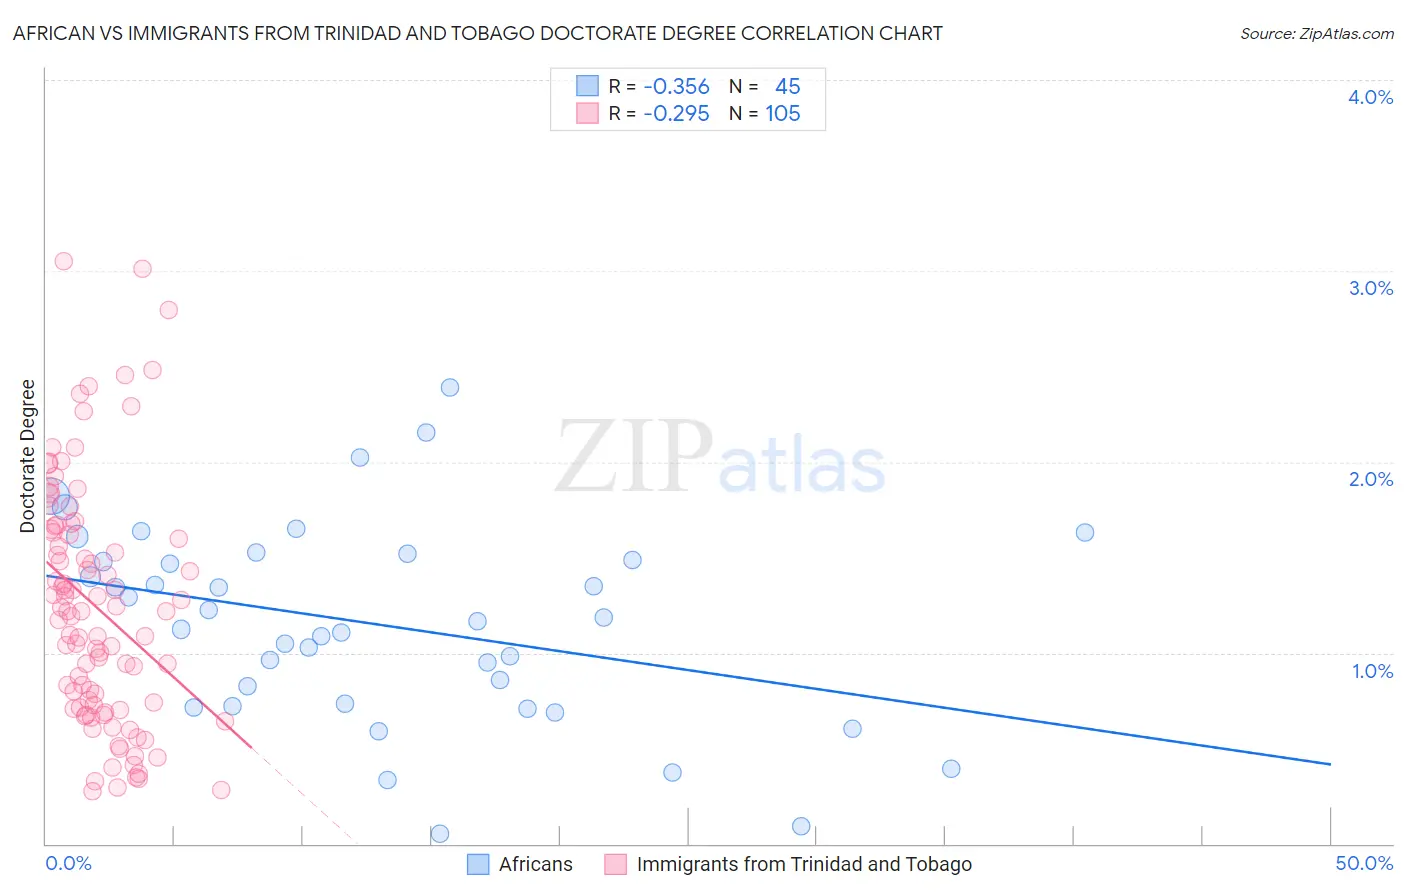
African vs Immigrants from Trinidad and Tobago Doctorate Degree Correlation Chart
The statistical analysis conducted on geographies consisting of 461,393,656 people shows a mild negative correlation between the proportion of Africans and percentage of population with at least doctorate degree education in the United States with a correlation coefficient (R) of -0.356 and weighted average of 1.6%. Similarly, the statistical analysis conducted on geographies consisting of 222,674,417 people shows a weak negative correlation between the proportion of Immigrants from Trinidad and Tobago and percentage of population with at least doctorate degree education in the United States with a correlation coefficient (R) of -0.295 and weighted average of 1.5%, a difference of 6.3%.
Doctorate Degree Correlation Summary
| Measurement | African | Immigrants from Trinidad and Tobago |
| Minimum | 0.049% | 0.28% |
| Maximum | 2.4% | 3.0% |
| Range | 2.3% | 2.8% |
| Mean | 1.2% | 1.2% |
| Median | 1.2% | 1.2% |
| Interquartile 25% (IQ1) | 0.73% | 0.71% |
| Interquartile 75% (IQ3) | 1.5% | 1.6% |
| Interquartile Range (IQR) | 0.78% | 0.93% |
| Standard Deviation (Sample) | 0.52% | 0.63% |
| Standard Deviation (Population) | 0.52% | 0.63% |
Similar Demographics by Doctorate Degree
Demographics Similar to Africans by Doctorate Degree
In terms of doctorate degree, the demographic groups most similar to Africans are Comanche (1.6%, a difference of 0.12%), Hmong (1.6%, a difference of 0.14%), Delaware (1.6%, a difference of 0.23%), Potawatomi (1.6%, a difference of 0.47%), and Immigrants from Fiji (1.6%, a difference of 0.50%).
| Demographics | Rating | Rank | Doctorate Degree |
| Cheyenne | 2.3 /100 | #241 | Tragic 1.6% |
| Ottawa | 2.2 /100 | #242 | Tragic 1.6% |
| Native Hawaiians | 2.1 /100 | #243 | Tragic 1.6% |
| French American Indians | 2.0 /100 | #244 | Tragic 1.6% |
| Delaware | 1.9 /100 | #245 | Tragic 1.6% |
| Hmong | 1.8 /100 | #246 | Tragic 1.6% |
| Comanche | 1.8 /100 | #247 | Tragic 1.6% |
| Africans | 1.8 /100 | #248 | Tragic 1.6% |
| Potawatomi | 1.6 /100 | #249 | Tragic 1.6% |
| Immigrants | Fiji | 1.6 /100 | #250 | Tragic 1.6% |
| Apache | 1.3 /100 | #251 | Tragic 1.5% |
| Yuman | 1.1 /100 | #252 | Tragic 1.5% |
| Americans | 1.0 /100 | #253 | Tragic 1.5% |
| Immigrants | Cambodia | 1.0 /100 | #254 | Tragic 1.5% |
| Trinidadians and Tobagonians | 1.0 /100 | #255 | Tragic 1.5% |
Demographics Similar to Immigrants from Trinidad and Tobago by Doctorate Degree
In terms of doctorate degree, the demographic groups most similar to Immigrants from Trinidad and Tobago are Salvadoran (1.5%, a difference of 0.070%), Immigrants from Barbados (1.5%, a difference of 0.090%), Crow (1.5%, a difference of 0.10%), Kiowa (1.5%, a difference of 0.19%), and U.S. Virgin Islander (1.5%, a difference of 0.19%).
| Demographics | Rating | Rank | Doctorate Degree |
| Blackfeet | 0.7 /100 | #264 | Tragic 1.5% |
| Nicaraguans | 0.6 /100 | #265 | Tragic 1.5% |
| Immigrants | Liberia | 0.5 /100 | #266 | Tragic 1.5% |
| Kiowa | 0.5 /100 | #267 | Tragic 1.5% |
| U.S. Virgin Islanders | 0.5 /100 | #268 | Tragic 1.5% |
| Crow | 0.5 /100 | #269 | Tragic 1.5% |
| Salvadorans | 0.5 /100 | #270 | Tragic 1.5% |
| Immigrants | Trinidad and Tobago | 0.5 /100 | #271 | Tragic 1.5% |
| Immigrants | Barbados | 0.4 /100 | #272 | Tragic 1.5% |
| Sioux | 0.4 /100 | #273 | Tragic 1.5% |
| Yaqui | 0.4 /100 | #274 | Tragic 1.5% |
| Aleuts | 0.4 /100 | #275 | Tragic 1.5% |
| Paiute | 0.4 /100 | #276 | Tragic 1.5% |
| Bahamians | 0.4 /100 | #277 | Tragic 1.5% |
| Hawaiians | 0.4 /100 | #278 | Tragic 1.5% |