West Indian vs Jamaican Master's Degree
COMPARE
West Indian
Jamaican
Master's Degree
Master's Degree Comparison
West Indians
Jamaicans
14.5%
MASTER'S DEGREE
27.4/ 100
METRIC RATING
198th/ 347
METRIC RANK
13.4%
MASTER'S DEGREE
4.1/ 100
METRIC RATING
237th/ 347
METRIC RANK
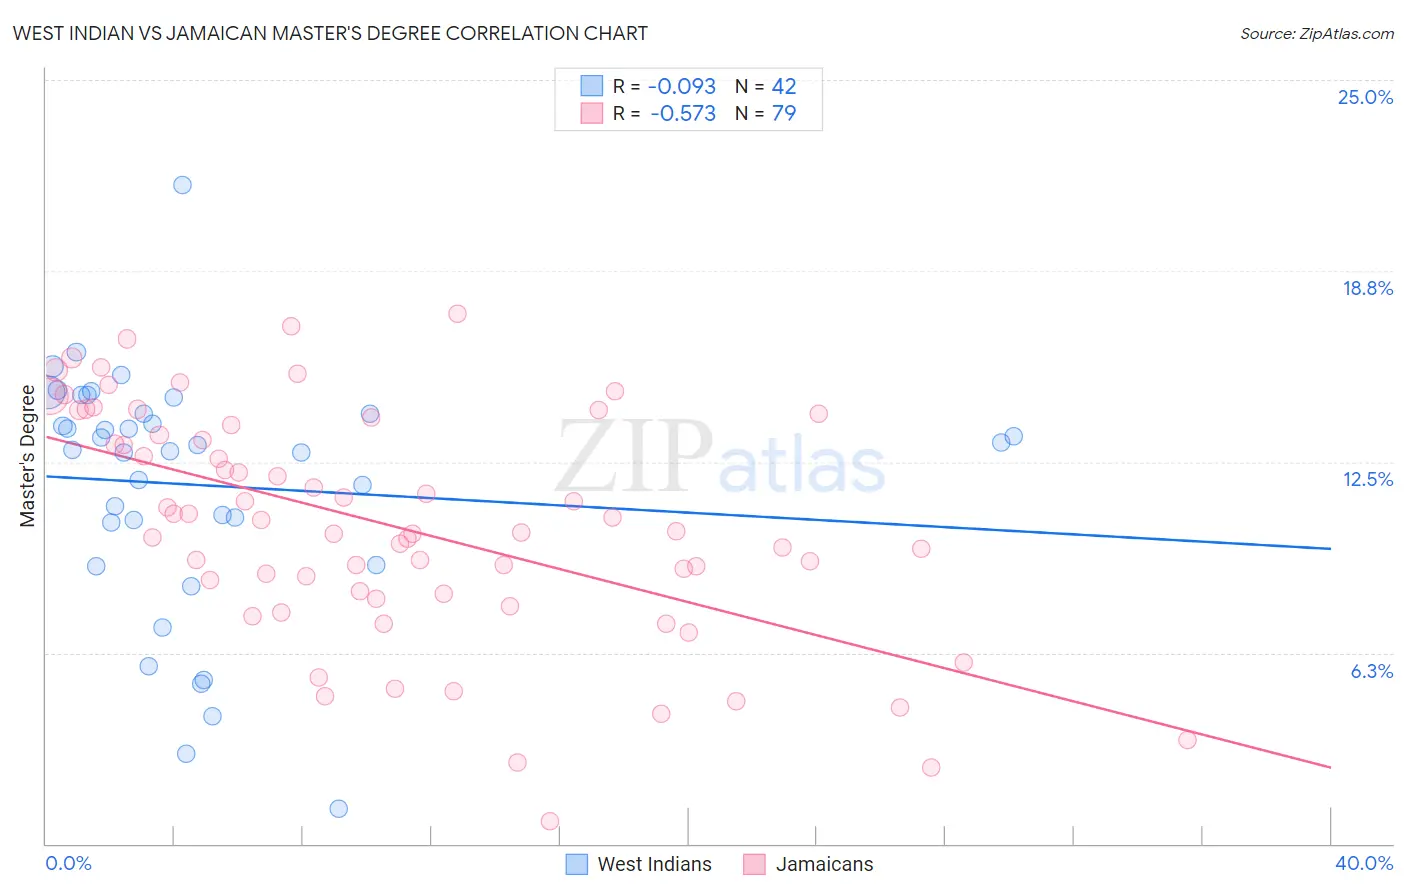
West Indian vs Jamaican Master's Degree Correlation Chart
The statistical analysis conducted on geographies consisting of 253,991,340 people shows a slight negative correlation between the proportion of West Indians and percentage of population with at least master's degree education in the United States with a correlation coefficient (R) of -0.093 and weighted average of 14.5%. Similarly, the statistical analysis conducted on geographies consisting of 367,857,102 people shows a substantial negative correlation between the proportion of Jamaicans and percentage of population with at least master's degree education in the United States with a correlation coefficient (R) of -0.573 and weighted average of 13.4%, a difference of 7.7%.
Master's Degree Correlation Summary
| Measurement | West Indian | Jamaican |
| Minimum | 1.1% | 0.72% |
| Maximum | 21.6% | 17.3% |
| Range | 20.4% | 16.6% |
| Mean | 11.7% | 10.4% |
| Median | 13.0% | 10.2% |
| Interquartile 25% (IQ1) | 10.5% | 8.2% |
| Interquartile 75% (IQ3) | 14.1% | 13.7% |
| Interquartile Range (IQR) | 3.6% | 5.5% |
| Standard Deviation (Sample) | 4.0% | 3.8% |
| Standard Deviation (Population) | 4.0% | 3.7% |
Similar Demographics by Master's Degree
Demographics Similar to West Indians by Master's Degree
In terms of master's degree, the demographic groups most similar to West Indians are Immigrants from Armenia (14.5%, a difference of 0.040%), Belgian (14.5%, a difference of 0.10%), Panamanian (14.4%, a difference of 0.40%), Czechoslovakian (14.5%, a difference of 0.41%), and Scotch-Irish (14.4%, a difference of 0.41%).
| Demographics | Rating | Rank | Master's Degree |
| Welsh | 34.2 /100 | #191 | Fair 14.6% |
| Immigrants | Middle Africa | 33.6 /100 | #192 | Fair 14.6% |
| Immigrants | Nigeria | 32.7 /100 | #193 | Fair 14.6% |
| Chinese | 32.5 /100 | #194 | Fair 14.6% |
| Danes | 31.3 /100 | #195 | Fair 14.5% |
| Czechoslovakians | 29.9 /100 | #196 | Fair 14.5% |
| Belgians | 28.0 /100 | #197 | Fair 14.5% |
| West Indians | 27.4 /100 | #198 | Fair 14.5% |
| Immigrants | Armenia | 27.2 /100 | #199 | Fair 14.5% |
| Panamanians | 25.1 /100 | #200 | Fair 14.4% |
| Scotch-Irish | 25.0 /100 | #201 | Fair 14.4% |
| Immigrants | Western Africa | 24.9 /100 | #202 | Fair 14.4% |
| Yugoslavians | 24.3 /100 | #203 | Fair 14.4% |
| French | 23.7 /100 | #204 | Fair 14.4% |
| Trinidadians and Tobagonians | 23.5 /100 | #205 | Fair 14.4% |
Demographics Similar to Jamaicans by Master's Degree
In terms of master's degree, the demographic groups most similar to Jamaicans are Hmong (13.4%, a difference of 0.14%), Immigrants from Guyana (13.4%, a difference of 0.22%), German Russian (13.5%, a difference of 0.34%), Nonimmigrants (13.3%, a difference of 0.67%), and Immigrants from Burma/Myanmar (13.5%, a difference of 0.75%).
| Demographics | Rating | Rank | Master's Degree |
| Dutch | 8.7 /100 | #230 | Tragic 13.8% |
| Guyanese | 7.6 /100 | #231 | Tragic 13.7% |
| Immigrants | Philippines | 6.0 /100 | #232 | Tragic 13.6% |
| Immigrants | Ecuador | 5.7 /100 | #233 | Tragic 13.6% |
| Immigrants | Burma/Myanmar | 5.0 /100 | #234 | Tragic 13.5% |
| German Russians | 4.5 /100 | #235 | Tragic 13.5% |
| Immigrants | Guyana | 4.4 /100 | #236 | Tragic 13.4% |
| Jamaicans | 4.1 /100 | #237 | Tragic 13.4% |
| Hmong | 4.0 /100 | #238 | Tragic 13.4% |
| Immigrants | Nonimmigrants | 3.4 /100 | #239 | Tragic 13.3% |
| Guamanians/Chamorros | 2.2 /100 | #240 | Tragic 13.1% |
| U.S. Virgin Islanders | 2.1 /100 | #241 | Tragic 13.1% |
| Spanish Americans | 1.9 /100 | #242 | Tragic 13.0% |
| Immigrants | Jamaica | 1.9 /100 | #243 | Tragic 13.0% |
| Delaware | 1.7 /100 | #244 | Tragic 13.0% |