Crow vs Jamaican No Schooling Completed
COMPARE
Crow
Jamaican
No Schooling Completed
No Schooling Completed Comparison
Crow
Jamaicans
1.6%
NO SCHOOLING COMPLETED
99.8/ 100
METRIC RATING
54th/ 347
METRIC RANK
2.4%
NO SCHOOLING COMPLETED
1.2/ 100
METRIC RATING
249th/ 347
METRIC RANK
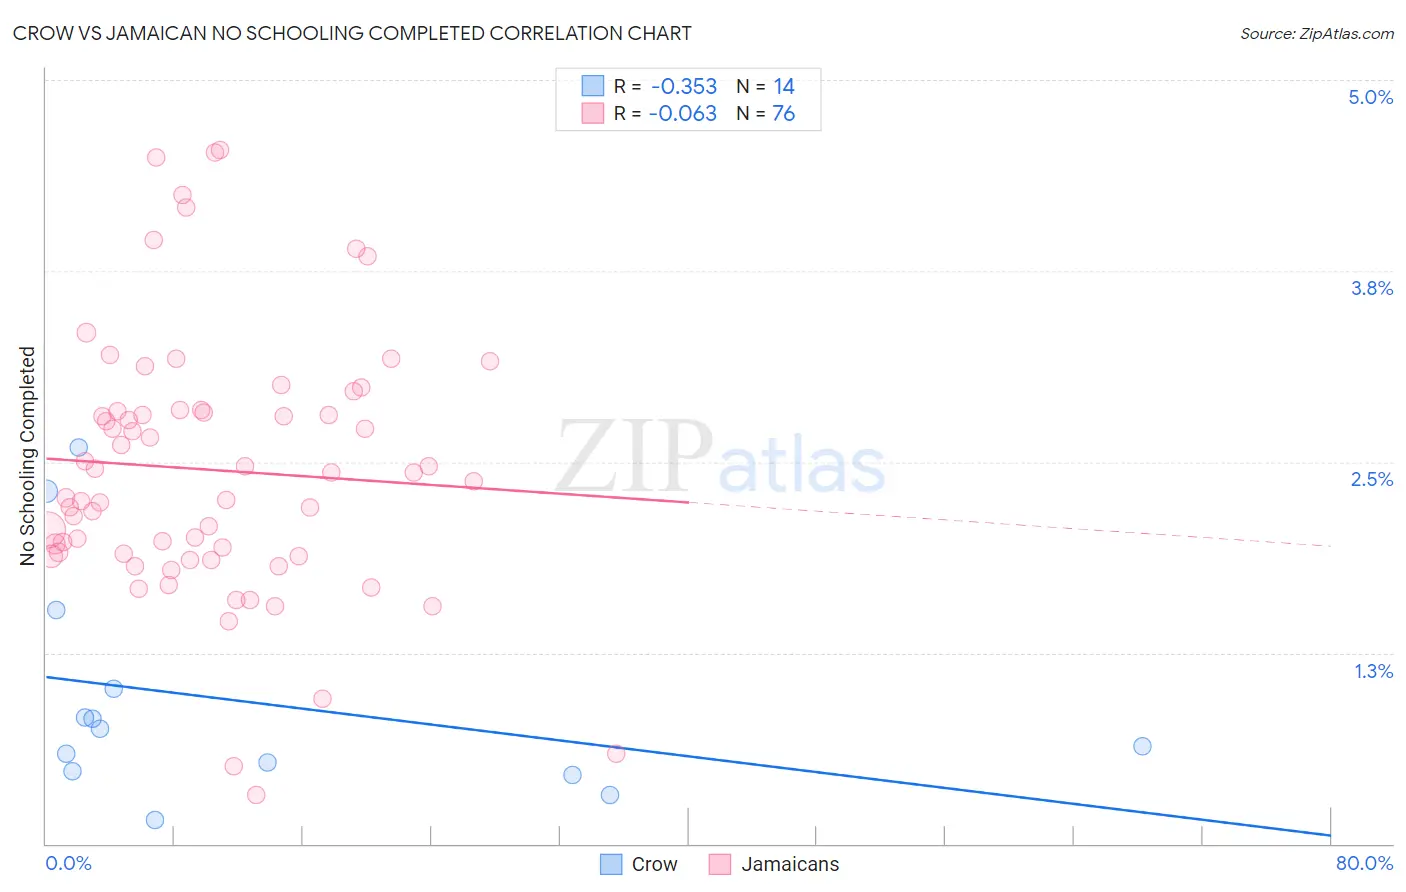
Crow vs Jamaican No Schooling Completed Correlation Chart
The statistical analysis conducted on geographies consisting of 58,922,127 people shows a mild negative correlation between the proportion of Crow and percentage of population with no schooling in the United States with a correlation coefficient (R) of -0.353 and weighted average of 1.6%. Similarly, the statistical analysis conducted on geographies consisting of 365,151,455 people shows a slight negative correlation between the proportion of Jamaicans and percentage of population with no schooling in the United States with a correlation coefficient (R) of -0.063 and weighted average of 2.4%, a difference of 46.6%.
No Schooling Completed Correlation Summary
| Measurement | Crow | Jamaican |
| Minimum | 0.16% | 0.32% |
| Maximum | 2.6% | 4.5% |
| Range | 2.4% | 4.2% |
| Mean | 0.93% | 2.4% |
| Median | 0.70% | 2.4% |
| Interquartile 25% (IQ1) | 0.47% | 1.9% |
| Interquartile 75% (IQ3) | 1.0% | 2.8% |
| Interquartile Range (IQR) | 0.55% | 0.94% |
| Standard Deviation (Sample) | 0.73% | 0.87% |
| Standard Deviation (Population) | 0.70% | 0.86% |
Similar Demographics by No Schooling Completed
Demographics Similar to Crow by No Schooling Completed
In terms of no schooling completed, the demographic groups most similar to Crow are Creek (1.6%, a difference of 0.030%), Greek (1.6%, a difference of 0.12%), Immigrants from North America (1.6%, a difference of 0.12%), Immigrants from Canada (1.6%, a difference of 0.16%), and Chippewa (1.6%, a difference of 0.23%).
| Demographics | Rating | Rank | No Schooling Completed |
| Ottawa | 99.9 /100 | #47 | Exceptional 1.6% |
| Immigrants | Scotland | 99.9 /100 | #48 | Exceptional 1.6% |
| Whites/Caucasians | 99.9 /100 | #49 | Exceptional 1.6% |
| Celtics | 99.9 /100 | #50 | Exceptional 1.6% |
| Chippewa | 99.8 /100 | #51 | Exceptional 1.6% |
| Immigrants | Canada | 99.8 /100 | #52 | Exceptional 1.6% |
| Creek | 99.8 /100 | #53 | Exceptional 1.6% |
| Crow | 99.8 /100 | #54 | Exceptional 1.6% |
| Greeks | 99.8 /100 | #55 | Exceptional 1.6% |
| Immigrants | North America | 99.8 /100 | #56 | Exceptional 1.6% |
| Austrians | 99.8 /100 | #57 | Exceptional 1.6% |
| Kiowa | 99.8 /100 | #58 | Exceptional 1.6% |
| Slavs | 99.8 /100 | #59 | Exceptional 1.7% |
| Americans | 99.8 /100 | #60 | Exceptional 1.7% |
| Tsimshian | 99.8 /100 | #61 | Exceptional 1.7% |
Demographics Similar to Jamaicans by No Schooling Completed
In terms of no schooling completed, the demographic groups most similar to Jamaicans are Immigrants from Middle Africa (2.4%, a difference of 0.050%), Immigrants from Africa (2.4%, a difference of 0.070%), Asian (2.4%, a difference of 0.19%), Immigrants from Iraq (2.4%, a difference of 0.45%), and Immigrants from Colombia (2.4%, a difference of 0.51%).
| Demographics | Rating | Rank | No Schooling Completed |
| Immigrants | Indonesia | 1.5 /100 | #242 | Tragic 2.4% |
| South Americans | 1.5 /100 | #243 | Tragic 2.4% |
| Peruvians | 1.4 /100 | #244 | Tragic 2.4% |
| Bolivians | 1.4 /100 | #245 | Tragic 2.4% |
| Immigrants | Congo | 1.4 /100 | #246 | Tragic 2.4% |
| Immigrants | Iraq | 1.3 /100 | #247 | Tragic 2.4% |
| Asians | 1.2 /100 | #248 | Tragic 2.4% |
| Jamaicans | 1.2 /100 | #249 | Tragic 2.4% |
| Immigrants | Middle Africa | 1.1 /100 | #250 | Tragic 2.4% |
| Immigrants | Africa | 1.1 /100 | #251 | Tragic 2.4% |
| Immigrants | Colombia | 1.0 /100 | #252 | Tragic 2.4% |
| Immigrants | Asia | 0.9 /100 | #253 | Tragic 2.4% |
| Immigrants | Eastern Africa | 0.9 /100 | #254 | Tragic 2.4% |
| Ethiopians | 0.8 /100 | #255 | Tragic 2.4% |
| Yaqui | 0.8 /100 | #256 | Tragic 2.4% |