Immigrants from Sierra Leone vs Jamaican Master's Degree
COMPARE
Immigrants from Sierra Leone
Jamaican
Master's Degree
Master's Degree Comparison
Immigrants from Sierra Leone
Jamaicans
16.3%
MASTER'S DEGREE
94.7/ 100
METRIC RATING
128th/ 347
METRIC RANK
13.4%
MASTER'S DEGREE
4.1/ 100
METRIC RATING
237th/ 347
METRIC RANK
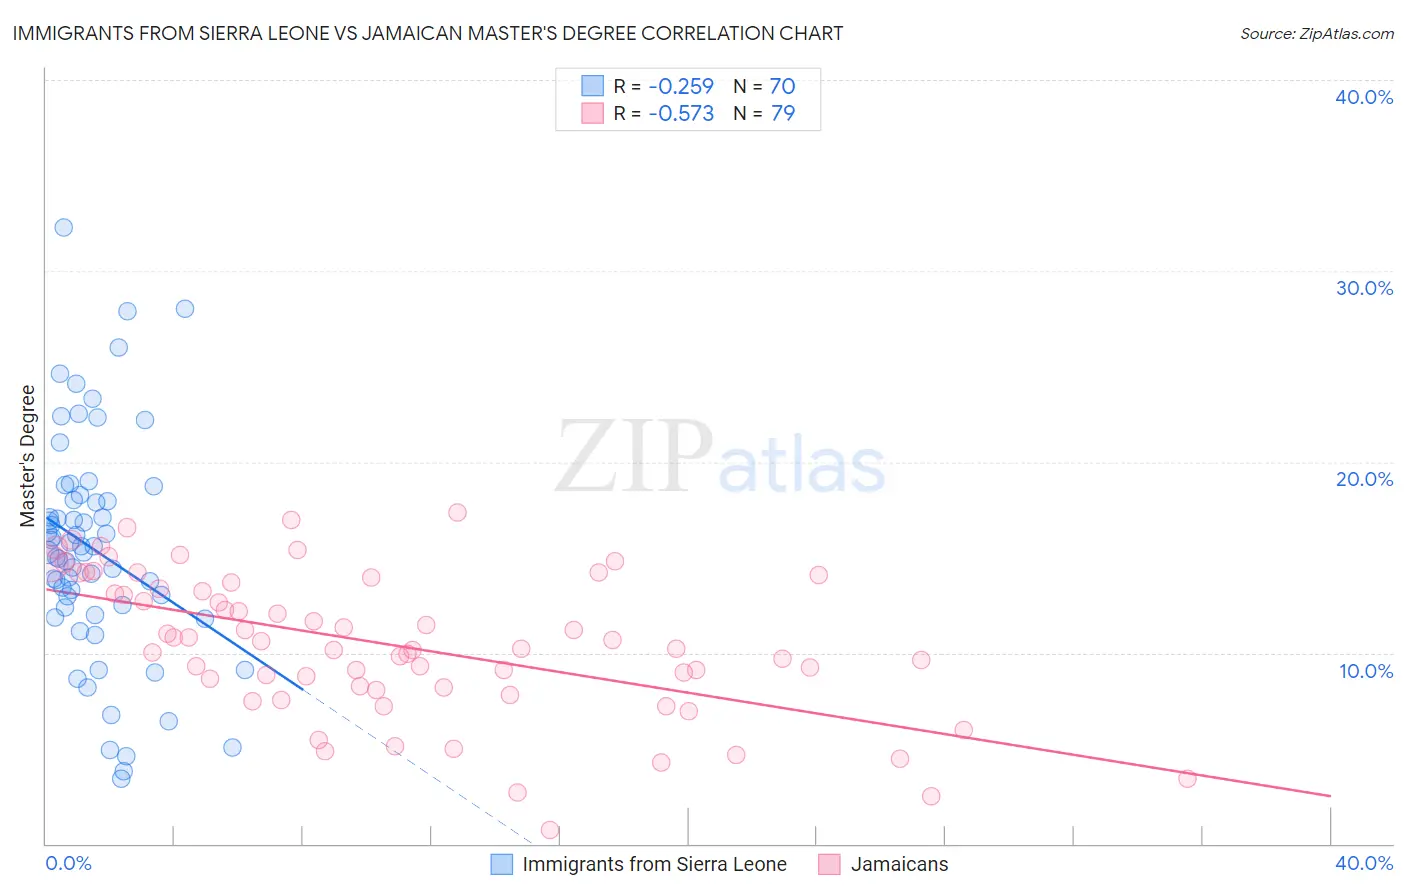
Immigrants from Sierra Leone vs Jamaican Master's Degree Correlation Chart
The statistical analysis conducted on geographies consisting of 101,623,305 people shows a weak negative correlation between the proportion of Immigrants from Sierra Leone and percentage of population with at least master's degree education in the United States with a correlation coefficient (R) of -0.259 and weighted average of 16.3%. Similarly, the statistical analysis conducted on geographies consisting of 367,857,102 people shows a substantial negative correlation between the proportion of Jamaicans and percentage of population with at least master's degree education in the United States with a correlation coefficient (R) of -0.573 and weighted average of 13.4%, a difference of 21.5%.
Master's Degree Correlation Summary
| Measurement | Immigrants from Sierra Leone | Jamaican |
| Minimum | 3.4% | 0.72% |
| Maximum | 32.2% | 17.3% |
| Range | 28.9% | 16.6% |
| Mean | 15.4% | 10.4% |
| Median | 15.4% | 10.2% |
| Interquartile 25% (IQ1) | 12.4% | 8.2% |
| Interquartile 75% (IQ3) | 18.0% | 13.7% |
| Interquartile Range (IQR) | 5.6% | 5.5% |
| Standard Deviation (Sample) | 5.9% | 3.8% |
| Standard Deviation (Population) | 5.8% | 3.7% |
Similar Demographics by Master's Degree
Demographics Similar to Immigrants from Sierra Leone by Master's Degree
In terms of master's degree, the demographic groups most similar to Immigrants from Sierra Leone are Palestinian (16.3%, a difference of 0.050%), Immigrants from Eastern Africa (16.3%, a difference of 0.31%), Italian (16.4%, a difference of 0.42%), Immigrants from Eritrea (16.4%, a difference of 0.50%), and Croatian (16.4%, a difference of 0.57%).
| Demographics | Rating | Rank | Master's Degree |
| Afghans | 96.2 /100 | #121 | Exceptional 16.5% |
| British | 95.6 /100 | #122 | Exceptional 16.4% |
| Croatians | 95.6 /100 | #123 | Exceptional 16.4% |
| Immigrants | Eritrea | 95.5 /100 | #124 | Exceptional 16.4% |
| Italians | 95.4 /100 | #125 | Exceptional 16.4% |
| Immigrants | Eastern Africa | 95.2 /100 | #126 | Exceptional 16.3% |
| Palestinians | 94.8 /100 | #127 | Exceptional 16.3% |
| Immigrants | Sierra Leone | 94.7 /100 | #128 | Exceptional 16.3% |
| Immigrants | Syria | 93.3 /100 | #129 | Exceptional 16.2% |
| Immigrants | Jordan | 92.7 /100 | #130 | Exceptional 16.1% |
| Taiwanese | 91.9 /100 | #131 | Exceptional 16.1% |
| Serbians | 91.7 /100 | #132 | Exceptional 16.1% |
| Immigrants | Sudan | 90.2 /100 | #133 | Exceptional 16.0% |
| Venezuelans | 88.4 /100 | #134 | Excellent 15.9% |
| South American Indians | 88.4 /100 | #135 | Excellent 15.9% |
Demographics Similar to Jamaicans by Master's Degree
In terms of master's degree, the demographic groups most similar to Jamaicans are Hmong (13.4%, a difference of 0.14%), Immigrants from Guyana (13.4%, a difference of 0.22%), German Russian (13.5%, a difference of 0.34%), Nonimmigrants (13.3%, a difference of 0.67%), and Immigrants from Burma/Myanmar (13.5%, a difference of 0.75%).
| Demographics | Rating | Rank | Master's Degree |
| Dutch | 8.7 /100 | #230 | Tragic 13.8% |
| Guyanese | 7.6 /100 | #231 | Tragic 13.7% |
| Immigrants | Philippines | 6.0 /100 | #232 | Tragic 13.6% |
| Immigrants | Ecuador | 5.7 /100 | #233 | Tragic 13.6% |
| Immigrants | Burma/Myanmar | 5.0 /100 | #234 | Tragic 13.5% |
| German Russians | 4.5 /100 | #235 | Tragic 13.5% |
| Immigrants | Guyana | 4.4 /100 | #236 | Tragic 13.4% |
| Jamaicans | 4.1 /100 | #237 | Tragic 13.4% |
| Hmong | 4.0 /100 | #238 | Tragic 13.4% |
| Immigrants | Nonimmigrants | 3.4 /100 | #239 | Tragic 13.3% |
| Guamanians/Chamorros | 2.2 /100 | #240 | Tragic 13.1% |
| U.S. Virgin Islanders | 2.1 /100 | #241 | Tragic 13.1% |
| Spanish Americans | 1.9 /100 | #242 | Tragic 13.0% |
| Immigrants | Jamaica | 1.9 /100 | #243 | Tragic 13.0% |
| Delaware | 1.7 /100 | #244 | Tragic 13.0% |