Immigrants from Trinidad and Tobago vs Jamaican Master's Degree
COMPARE
Immigrants from Trinidad and Tobago
Jamaican
Master's Degree
Master's Degree Comparison
Immigrants from Trinidad and Tobago
Jamaicans
14.1%
MASTER'S DEGREE
15.8/ 100
METRIC RATING
217th/ 347
METRIC RANK
13.4%
MASTER'S DEGREE
4.1/ 100
METRIC RATING
237th/ 347
METRIC RANK
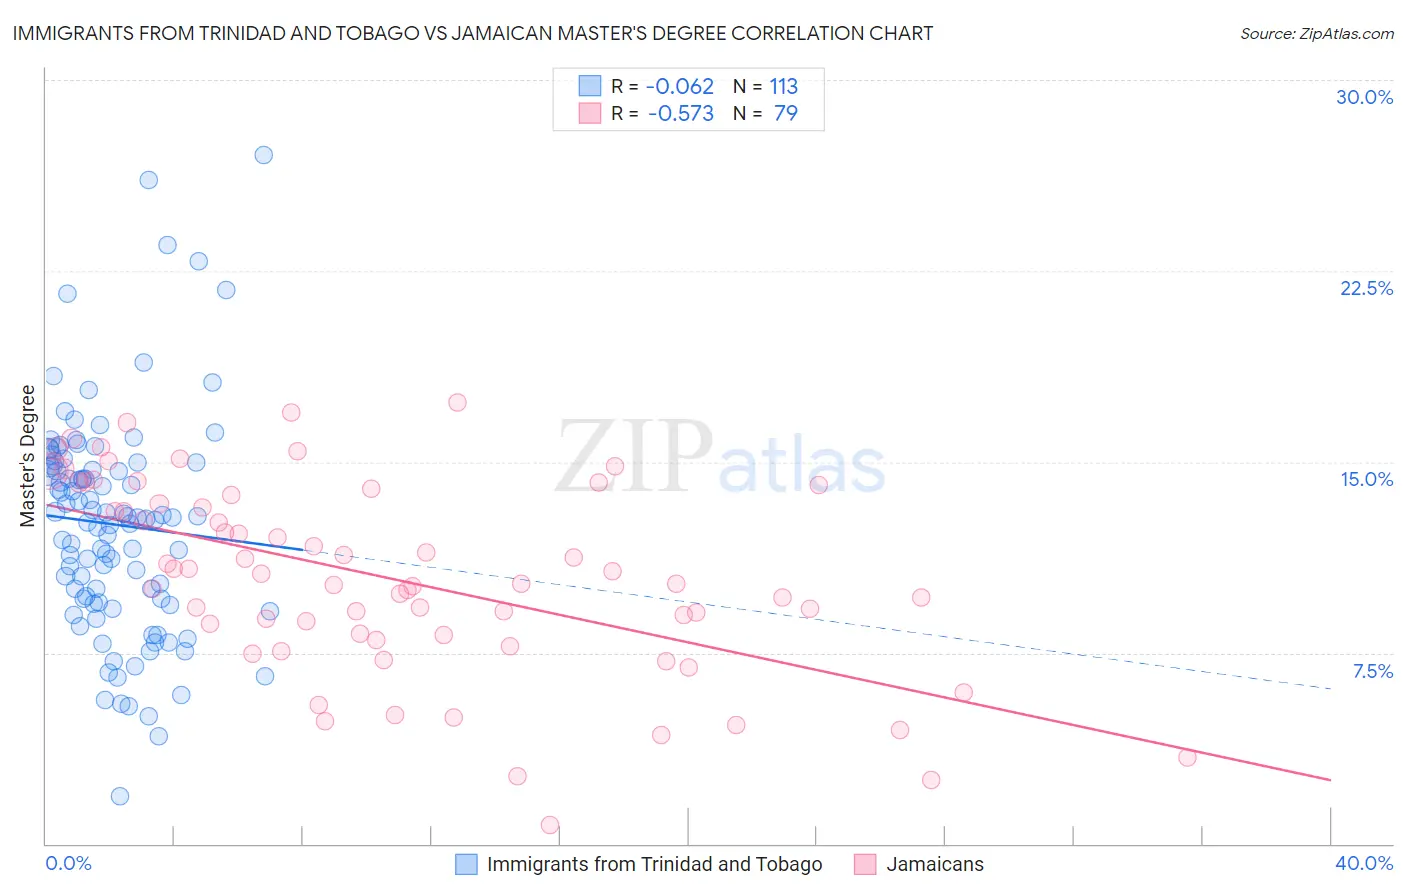
Immigrants from Trinidad and Tobago vs Jamaican Master's Degree Correlation Chart
The statistical analysis conducted on geographies consisting of 223,499,592 people shows a slight negative correlation between the proportion of Immigrants from Trinidad and Tobago and percentage of population with at least master's degree education in the United States with a correlation coefficient (R) of -0.062 and weighted average of 14.1%. Similarly, the statistical analysis conducted on geographies consisting of 367,857,102 people shows a substantial negative correlation between the proportion of Jamaicans and percentage of population with at least master's degree education in the United States with a correlation coefficient (R) of -0.573 and weighted average of 13.4%, a difference of 5.3%.
Master's Degree Correlation Summary
| Measurement | Immigrants from Trinidad and Tobago | Jamaican |
| Minimum | 1.9% | 0.72% |
| Maximum | 27.1% | 17.3% |
| Range | 25.2% | 16.6% |
| Mean | 12.5% | 10.4% |
| Median | 12.8% | 10.2% |
| Interquartile 25% (IQ1) | 9.5% | 8.2% |
| Interquartile 75% (IQ3) | 14.9% | 13.7% |
| Interquartile Range (IQR) | 5.4% | 5.5% |
| Standard Deviation (Sample) | 4.3% | 3.8% |
| Standard Deviation (Population) | 4.3% | 3.7% |
Demographics Similar to Immigrants from Trinidad and Tobago and Jamaicans by Master's Degree
In terms of master's degree, the demographic groups most similar to Immigrants from Trinidad and Tobago are French Canadian (14.1%, a difference of 0.25%), Norwegian (14.0%, a difference of 0.59%), German (14.0%, a difference of 0.75%), Korean (14.0%, a difference of 0.88%), and Ecuadorian (14.0%, a difference of 0.92%). Similarly, the demographic groups most similar to Jamaicans are Immigrants from Guyana (13.4%, a difference of 0.22%), German Russian (13.5%, a difference of 0.34%), Immigrants from Burma/Myanmar (13.5%, a difference of 0.75%), Immigrants from Ecuador (13.6%, a difference of 1.3%), and Immigrants from Philippines (13.6%, a difference of 1.4%).
| Demographics | Rating | Rank | Master's Degree |
| Immigrants | Trinidad and Tobago | 15.8 /100 | #217 | Poor 14.1% |
| French Canadians | 14.9 /100 | #218 | Poor 14.1% |
| Norwegians | 13.6 /100 | #219 | Poor 14.0% |
| Germans | 13.1 /100 | #220 | Poor 14.0% |
| Koreans | 12.7 /100 | #221 | Poor 14.0% |
| Ecuadorians | 12.6 /100 | #222 | Poor 14.0% |
| Immigrants | South Eastern Asia | 11.9 /100 | #223 | Poor 14.0% |
| Immigrants | Grenada | 11.8 /100 | #224 | Poor 14.0% |
| Portuguese | 11.2 /100 | #225 | Poor 13.9% |
| Immigrants | St. Vincent and the Grenadines | 11.0 /100 | #226 | Poor 13.9% |
| Immigrants | West Indies | 9.8 /100 | #227 | Tragic 13.9% |
| Whites/Caucasians | 9.1 /100 | #228 | Tragic 13.8% |
| British West Indians | 8.8 /100 | #229 | Tragic 13.8% |
| Dutch | 8.7 /100 | #230 | Tragic 13.8% |
| Guyanese | 7.6 /100 | #231 | Tragic 13.7% |
| Immigrants | Philippines | 6.0 /100 | #232 | Tragic 13.6% |
| Immigrants | Ecuador | 5.7 /100 | #233 | Tragic 13.6% |
| Immigrants | Burma/Myanmar | 5.0 /100 | #234 | Tragic 13.5% |
| German Russians | 4.5 /100 | #235 | Tragic 13.5% |
| Immigrants | Guyana | 4.4 /100 | #236 | Tragic 13.4% |
| Jamaicans | 4.1 /100 | #237 | Tragic 13.4% |