Immigrants from Turkey vs Jamaican Master's Degree
COMPARE
Immigrants from Turkey
Jamaican
Master's Degree
Master's Degree Comparison
Immigrants from Turkey
Jamaicans
19.7%
MASTER'S DEGREE
100.0/ 100
METRIC RATING
30th/ 347
METRIC RANK
13.4%
MASTER'S DEGREE
4.1/ 100
METRIC RATING
237th/ 347
METRIC RANK
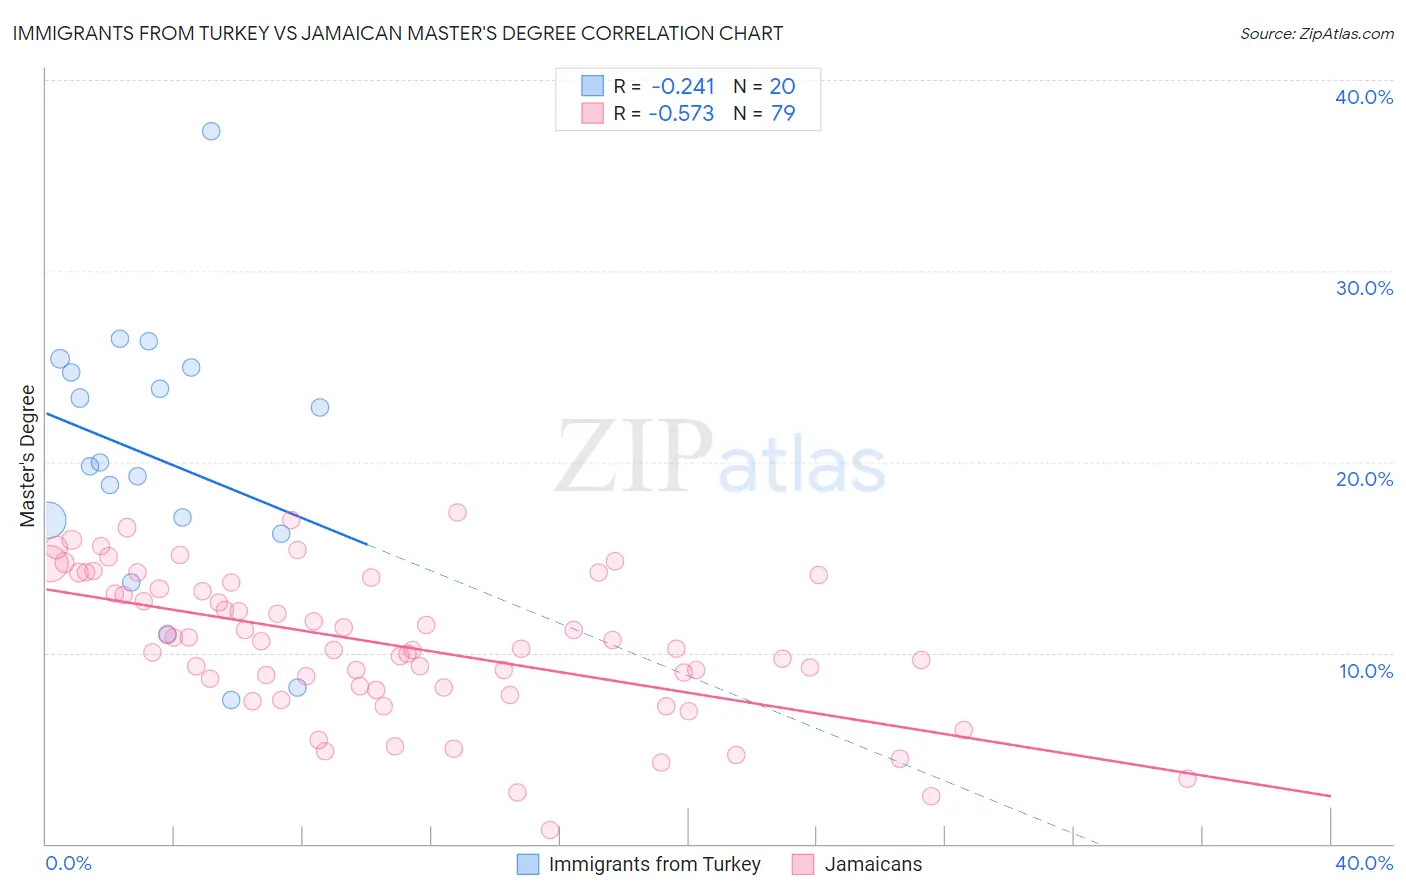
Immigrants from Turkey vs Jamaican Master's Degree Correlation Chart
The statistical analysis conducted on geographies consisting of 223,018,840 people shows a weak negative correlation between the proportion of Immigrants from Turkey and percentage of population with at least master's degree education in the United States with a correlation coefficient (R) of -0.241 and weighted average of 19.7%. Similarly, the statistical analysis conducted on geographies consisting of 367,857,102 people shows a substantial negative correlation between the proportion of Jamaicans and percentage of population with at least master's degree education in the United States with a correlation coefficient (R) of -0.573 and weighted average of 13.4%, a difference of 46.9%.
Master's Degree Correlation Summary
| Measurement | Immigrants from Turkey | Jamaican |
| Minimum | 7.6% | 0.72% |
| Maximum | 37.3% | 17.3% |
| Range | 29.8% | 16.6% |
| Mean | 20.2% | 10.4% |
| Median | 19.9% | 10.2% |
| Interquartile 25% (IQ1) | 16.6% | 8.2% |
| Interquartile 75% (IQ3) | 24.8% | 13.7% |
| Interquartile Range (IQR) | 8.2% | 5.5% |
| Standard Deviation (Sample) | 7.0% | 3.8% |
| Standard Deviation (Population) | 6.9% | 3.7% |
Similar Demographics by Master's Degree
Demographics Similar to Immigrants from Turkey by Master's Degree
In terms of master's degree, the demographic groups most similar to Immigrants from Turkey are Immigrants from Korea (19.7%, a difference of 0.010%), Burmese (19.7%, a difference of 0.080%), Latvian (19.8%, a difference of 0.50%), Russian (19.5%, a difference of 0.86%), and Immigrants from Denmark (19.5%, a difference of 0.89%).
| Demographics | Rating | Rank | Master's Degree |
| Immigrants | France | 100.0 /100 | #23 | Exceptional 20.3% |
| Immigrants | Sweden | 100.0 /100 | #24 | Exceptional 20.3% |
| Immigrants | Japan | 100.0 /100 | #25 | Exceptional 20.0% |
| Cambodians | 100.0 /100 | #26 | Exceptional 20.0% |
| Immigrants | Sri Lanka | 100.0 /100 | #27 | Exceptional 19.9% |
| Turks | 100.0 /100 | #28 | Exceptional 19.9% |
| Latvians | 100.0 /100 | #29 | Exceptional 19.8% |
| Immigrants | Turkey | 100.0 /100 | #30 | Exceptional 19.7% |
| Immigrants | Korea | 100.0 /100 | #31 | Exceptional 19.7% |
| Burmese | 100.0 /100 | #32 | Exceptional 19.7% |
| Russians | 100.0 /100 | #33 | Exceptional 19.5% |
| Immigrants | Denmark | 100.0 /100 | #34 | Exceptional 19.5% |
| Immigrants | Northern Europe | 100.0 /100 | #35 | Exceptional 19.5% |
| Immigrants | Russia | 100.0 /100 | #36 | Exceptional 19.4% |
| Mongolians | 100.0 /100 | #37 | Exceptional 19.4% |
Demographics Similar to Jamaicans by Master's Degree
In terms of master's degree, the demographic groups most similar to Jamaicans are Hmong (13.4%, a difference of 0.14%), Immigrants from Guyana (13.4%, a difference of 0.22%), German Russian (13.5%, a difference of 0.34%), Nonimmigrants (13.3%, a difference of 0.67%), and Immigrants from Burma/Myanmar (13.5%, a difference of 0.75%).
| Demographics | Rating | Rank | Master's Degree |
| Dutch | 8.7 /100 | #230 | Tragic 13.8% |
| Guyanese | 7.6 /100 | #231 | Tragic 13.7% |
| Immigrants | Philippines | 6.0 /100 | #232 | Tragic 13.6% |
| Immigrants | Ecuador | 5.7 /100 | #233 | Tragic 13.6% |
| Immigrants | Burma/Myanmar | 5.0 /100 | #234 | Tragic 13.5% |
| German Russians | 4.5 /100 | #235 | Tragic 13.5% |
| Immigrants | Guyana | 4.4 /100 | #236 | Tragic 13.4% |
| Jamaicans | 4.1 /100 | #237 | Tragic 13.4% |
| Hmong | 4.0 /100 | #238 | Tragic 13.4% |
| Immigrants | Nonimmigrants | 3.4 /100 | #239 | Tragic 13.3% |
| Guamanians/Chamorros | 2.2 /100 | #240 | Tragic 13.1% |
| U.S. Virgin Islanders | 2.1 /100 | #241 | Tragic 13.1% |
| Spanish Americans | 1.9 /100 | #242 | Tragic 13.0% |
| Immigrants | Jamaica | 1.9 /100 | #243 | Tragic 13.0% |
| Delaware | 1.7 /100 | #244 | Tragic 13.0% |