Immigrants from Barbados vs Jamaican Master's Degree
COMPARE
Immigrants from Barbados
Jamaican
Master's Degree
Master's Degree Comparison
Immigrants from Barbados
Jamaicans
14.3%
MASTER'S DEGREE
20.5/ 100
METRIC RATING
208th/ 347
METRIC RANK
13.4%
MASTER'S DEGREE
4.1/ 100
METRIC RATING
237th/ 347
METRIC RANK
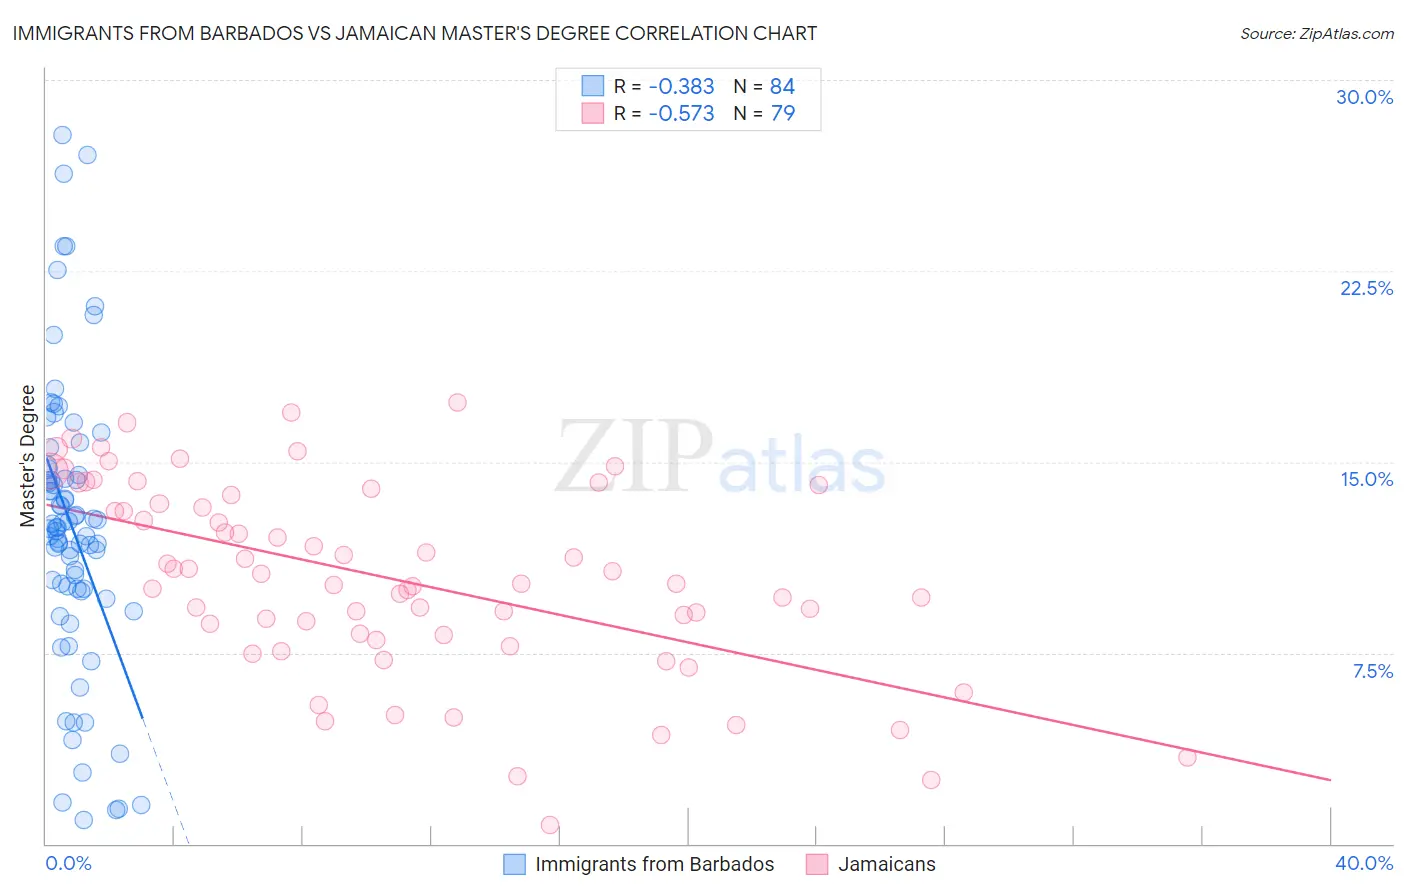
Immigrants from Barbados vs Jamaican Master's Degree Correlation Chart
The statistical analysis conducted on geographies consisting of 112,776,866 people shows a mild negative correlation between the proportion of Immigrants from Barbados and percentage of population with at least master's degree education in the United States with a correlation coefficient (R) of -0.383 and weighted average of 14.3%. Similarly, the statistical analysis conducted on geographies consisting of 367,857,102 people shows a substantial negative correlation between the proportion of Jamaicans and percentage of population with at least master's degree education in the United States with a correlation coefficient (R) of -0.573 and weighted average of 13.4%, a difference of 6.4%.
Master's Degree Correlation Summary
| Measurement | Immigrants from Barbados | Jamaican |
| Minimum | 0.92% | 0.72% |
| Maximum | 27.8% | 17.3% |
| Range | 26.9% | 16.6% |
| Mean | 12.5% | 10.4% |
| Median | 12.4% | 10.2% |
| Interquartile 25% (IQ1) | 10.0% | 8.2% |
| Interquartile 75% (IQ3) | 14.6% | 13.7% |
| Interquartile Range (IQR) | 4.6% | 5.5% |
| Standard Deviation (Sample) | 5.7% | 3.8% |
| Standard Deviation (Population) | 5.6% | 3.7% |
Similar Demographics by Master's Degree
Demographics Similar to Immigrants from Barbados by Master's Degree
In terms of master's degree, the demographic groups most similar to Immigrants from Barbados are Immigrants from Panama (14.3%, a difference of 0.090%), Subsaharan African (14.2%, a difference of 0.22%), Immigrants from Bosnia and Herzegovina (14.3%, a difference of 0.30%), Somali (14.2%, a difference of 0.53%), and Scandinavian (14.4%, a difference of 0.55%).
| Demographics | Rating | Rank | Master's Degree |
| Scotch-Irish | 25.0 /100 | #201 | Fair 14.4% |
| Immigrants | Western Africa | 24.9 /100 | #202 | Fair 14.4% |
| Yugoslavians | 24.3 /100 | #203 | Fair 14.4% |
| French | 23.7 /100 | #204 | Fair 14.4% |
| Trinidadians and Tobagonians | 23.5 /100 | #205 | Fair 14.4% |
| Scandinavians | 23.3 /100 | #206 | Fair 14.4% |
| Immigrants | Bosnia and Herzegovina | 22.0 /100 | #207 | Fair 14.3% |
| Immigrants | Barbados | 20.5 /100 | #208 | Fair 14.3% |
| Immigrants | Panama | 20.0 /100 | #209 | Fair 14.3% |
| Sub-Saharan Africans | 19.4 /100 | #210 | Poor 14.2% |
| Somalis | 18.0 /100 | #211 | Poor 14.2% |
| Spanish | 17.8 /100 | #212 | Poor 14.2% |
| Immigrants | Thailand | 17.0 /100 | #213 | Poor 14.2% |
| Finns | 16.9 /100 | #214 | Poor 14.2% |
| Immigrants | Vietnam | 16.1 /100 | #215 | Poor 14.1% |
Demographics Similar to Jamaicans by Master's Degree
In terms of master's degree, the demographic groups most similar to Jamaicans are Hmong (13.4%, a difference of 0.14%), Immigrants from Guyana (13.4%, a difference of 0.22%), German Russian (13.5%, a difference of 0.34%), Nonimmigrants (13.3%, a difference of 0.67%), and Immigrants from Burma/Myanmar (13.5%, a difference of 0.75%).
| Demographics | Rating | Rank | Master's Degree |
| Dutch | 8.7 /100 | #230 | Tragic 13.8% |
| Guyanese | 7.6 /100 | #231 | Tragic 13.7% |
| Immigrants | Philippines | 6.0 /100 | #232 | Tragic 13.6% |
| Immigrants | Ecuador | 5.7 /100 | #233 | Tragic 13.6% |
| Immigrants | Burma/Myanmar | 5.0 /100 | #234 | Tragic 13.5% |
| German Russians | 4.5 /100 | #235 | Tragic 13.5% |
| Immigrants | Guyana | 4.4 /100 | #236 | Tragic 13.4% |
| Jamaicans | 4.1 /100 | #237 | Tragic 13.4% |
| Hmong | 4.0 /100 | #238 | Tragic 13.4% |
| Immigrants | Nonimmigrants | 3.4 /100 | #239 | Tragic 13.3% |
| Guamanians/Chamorros | 2.2 /100 | #240 | Tragic 13.1% |
| U.S. Virgin Islanders | 2.1 /100 | #241 | Tragic 13.1% |
| Spanish Americans | 1.9 /100 | #242 | Tragic 13.0% |
| Immigrants | Jamaica | 1.9 /100 | #243 | Tragic 13.0% |
| Delaware | 1.7 /100 | #244 | Tragic 13.0% |