Israeli vs Immigrants from Grenada Master's Degree

COMPARE

Israeli
Race
Ancestry
AfghanAfricanAlaska NativeAlaskan AthabascanAlbanianAleutAlsatianAmericanApacheArabArapahoArgentineanArmenianAssyrian/Chaldean/SyriacAustralianAustrianBahamianBangladeshiBarbadianBasqueBelgianBelizeanBermudanBhutaneseBlackfeetBolivianBrazilianBritishBritish West IndianBulgarianBurmeseCajunCambodianCanadianCape VerdeanCarpatho RusynCelticCentral AmericanCentral American IndianCherokeeCheyenneChickasawChileanChineseChippewaChoctawColombianColvilleComancheCosta RicanCreeCreekCroatianCrowCubanCypriotCzechCzechoslovakianDanishDelawareDominicanDutchDutch West IndianEastern EuropeanEcuadorianEgyptianEnglishEstonianEthiopianEuropeanFijianFilipinoFinnishFrenchFrench American IndianFrench CanadianGermanGerman RussianGhanaianGreekGuamanian/ChamorroGuatemalanGuyaneseHaitianHmongHonduranHopiHoumaHungarianIcelanderIndian (Asian)IndonesianInupiatIranianIraqiIrishIroquoisIsraeliItalianJamaicanJapaneseJordanianKenyanKiowaKoreanLaotianLatvianLebaneseLiberianLithuanianLumbeeLuxembourgerMacedonianMalaysianMalteseMarshalleseMenomineeMexicanMexican American IndianMongolianMoroccanNative HawaiianNavajoNepaleseNew ZealanderNicaraguanNigerianNorthern EuropeanNorwegianOkinawanOsageOttawaPaiutePakistaniPalestinianPanamanianParaguayanPennsylvania GermanPeruvianPimaPolishPortuguesePotawatomiPuebloPuerto RicanPuget Sound SalishRomanianRussianSalvadoranSamoanScandinavianScotch-IrishScottishSeminoleSenegaleseSerbianShoshoneSierra LeoneanSiouxSlavicSlovakSloveneSomaliSouth AfricanSouth AmericanSouth American IndianSoviet UnionSpaniardSpanishSpanish AmericanSpanish American IndianSri LankanSubsaharan AfricanSudaneseSwedishSwissSyrianTaiwaneseThaiTlingit-HaidaTohono O'OdhamTonganTrinidadian and TobagonianTsimshianTurkishU.S. Virgin IslanderUgandanUkrainianUruguayanUteVenezuelanVietnameseWelshWest IndianYakamaYaquiYugoslavianYumanYup'ikZimbabwean
Immigration
NonimmigrantsImmigrantsAfghanistanAfricaAlbaniaArgentinaArmeniaAsiaAustraliaAustriaBahamasBangladeshBarbadosBelarusBelgiumBelizeBoliviaBosnia and HerzegovinaBrazilBulgariaBurma/MyanmarCabo VerdeCambodiaCameroonCanadaCaribbeanCentral AmericaChileChinaColombiaCongoCosta RicaCroatiaCubaCzechoslovakiaDenmarkDominicaDominican RepublicEastern AfricaEastern AsiaEastern EuropeEcuadorEgyptEl SalvadorEnglandEritreaEthiopiaEuropeFijiFranceGermanyGhanaGreeceGuatemalaGuyanaHaitiHondurasHong KongHungaryIndiaIndonesiaIranIraqIrelandIsraelItalyJamaicaJapanJordanKazakhstanKenyaKoreaKuwaitLaosLatin AmericaLatviaLebanonLiberiaLithuaniaMalaysiaMexicoMicronesiaMiddle AfricaMoldovaMoroccoNepalNetherlandsNicaraguaNigeriaNorth AmericaNorth MacedoniaNorthern AfricaNorthern EuropeNorwayOceaniaPakistanPanamaPeruPhilippinesPolandPortugalRomaniaRussiaSaudi ArabiaScotlandSenegalSerbiaSierra LeoneSingaporeSomaliaSouth AfricaSouth AmericaSouth Central AsiaSouth Eastern AsiaSouthern EuropeSpainSri LankaSt. Vincent and the GrenadinesSudanSwedenSwitzerlandSyriaTaiwanThailandTrinidad and TobagoTurkeyUgandaUkraineUruguayUzbekistanVenezuelaVietnamWest IndiesWestern AfricaWestern AsiaWestern EuropeYemenZaireZimbabweAzores
Immigrants from Grenada
Race
Ancestry
AfghanAfricanAlaska NativeAlaskan AthabascanAlbanianAleutAlsatianAmericanApacheArabArapahoArgentineanArmenianAssyrian/Chaldean/SyriacAustralianAustrianBahamianBangladeshiBarbadianBasqueBelgianBelizeanBermudanBhutaneseBlackfeetBolivianBrazilianBritishBritish West IndianBulgarianBurmeseCajunCambodianCanadianCape VerdeanCarpatho RusynCelticCentral AmericanCentral American IndianCherokeeCheyenneChickasawChileanChineseChippewaChoctawColombianColvilleComancheCosta RicanCreeCreekCroatianCrowCubanCypriotCzechCzechoslovakianDanishDelawareDominicanDutchDutch West IndianEastern EuropeanEcuadorianEgyptianEnglishEstonianEthiopianEuropeanFijianFilipinoFinnishFrenchFrench American IndianFrench CanadianGermanGerman RussianGhanaianGreekGuamanian/ChamorroGuatemalanGuyaneseHaitianHmongHonduranHopiHoumaHungarianIcelanderIndian (Asian)IndonesianInupiatIranianIraqiIrishIroquoisItalianJamaicanJapaneseJordanianKenyanKiowaKoreanLaotianLatvianLebaneseLiberianLithuanianLumbeeLuxembourgerMacedonianMalaysianMalteseMarshalleseMenomineeMexicanMexican American IndianMongolianMoroccanNative HawaiianNavajoNepaleseNew ZealanderNicaraguanNigerianNorthern EuropeanNorwegianOkinawanOsageOttawaPaiutePakistaniPalestinianPanamanianParaguayanPennsylvania GermanPeruvianPimaPolishPortuguesePotawatomiPuebloPuerto RicanPuget Sound SalishRomanianRussianSalvadoranSamoanScandinavianScotch-IrishScottishSeminoleSenegaleseSerbianShoshoneSierra LeoneanSiouxSlavicSlovakSloveneSomaliSouth AfricanSouth AmericanSouth American IndianSoviet UnionSpaniardSpanishSpanish AmericanSpanish American IndianSri LankanSubsaharan AfricanSudaneseSwedishSwissSyrianTaiwaneseThaiTlingit-HaidaTohono O'OdhamTonganTrinidadian and TobagonianTsimshianTurkishU.S. Virgin IslanderUgandanUkrainianUruguayanUteVenezuelanVietnameseWelshWest IndianYakamaYaquiYugoslavianYumanYup'ikZimbabwean
Immigration
NonimmigrantsImmigrantsAfghanistanAfricaAlbaniaArgentinaArmeniaAsiaAustraliaAustriaBahamasBangladeshBarbadosBelarusBelgiumBelizeBoliviaBosnia and HerzegovinaBrazilBulgariaBurma/MyanmarCabo VerdeCambodiaCameroonCanadaCaribbeanCentral AmericaChileChinaColombiaCongoCosta RicaCroatiaCubaCzechoslovakiaDenmarkDominicaDominican RepublicEastern AfricaEastern AsiaEastern EuropeEcuadorEgyptEl SalvadorEnglandEritreaEthiopiaEuropeFijiFranceGermanyGhanaGreeceGrenadaGuatemalaGuyanaHaitiHondurasHong KongHungaryIndiaIndonesiaIranIraqIrelandIsraelItalyJamaicaJapanJordanKazakhstanKenyaKoreaKuwaitLaosLatin AmericaLatviaLebanonLiberiaLithuaniaMalaysiaMexicoMicronesiaMiddle AfricaMoldovaMoroccoNepalNetherlandsNicaraguaNigeriaNorth AmericaNorth MacedoniaNorthern AfricaNorthern EuropeNorwayOceaniaPakistanPanamaPeruPhilippinesPolandPortugalRomaniaRussiaSaudi ArabiaScotlandSenegalSerbiaSierra LeoneSingaporeSomaliaSouth AfricaSouth AmericaSouth Central AsiaSouth Eastern AsiaSouthern EuropeSpainSri LankaSt. Vincent and the GrenadinesSudanSwedenSwitzerlandSyriaTaiwanThailandTrinidad and TobagoTurkeyUgandaUkraineUruguayUzbekistanVenezuelaVietnamWest IndiesWestern AfricaWestern AsiaWestern EuropeYemenZaireZimbabweAzores
Master's Degree
Income
Poverty
Unemployment
Labor Participation
Family Structure
Vehicle Availability
Education Level
Disability

Master's Degree Comparison

Israelis

Immigrants from Grenada

Exceptional
Poor
20.3%
MASTER'S DEGREE
100.0/ 100
METRIC RATING
22nd/ 347
METRIC RANK
14.0%
MASTER'S DEGREE
11.8/ 100
METRIC RATING
224th/ 347
METRIC RANK

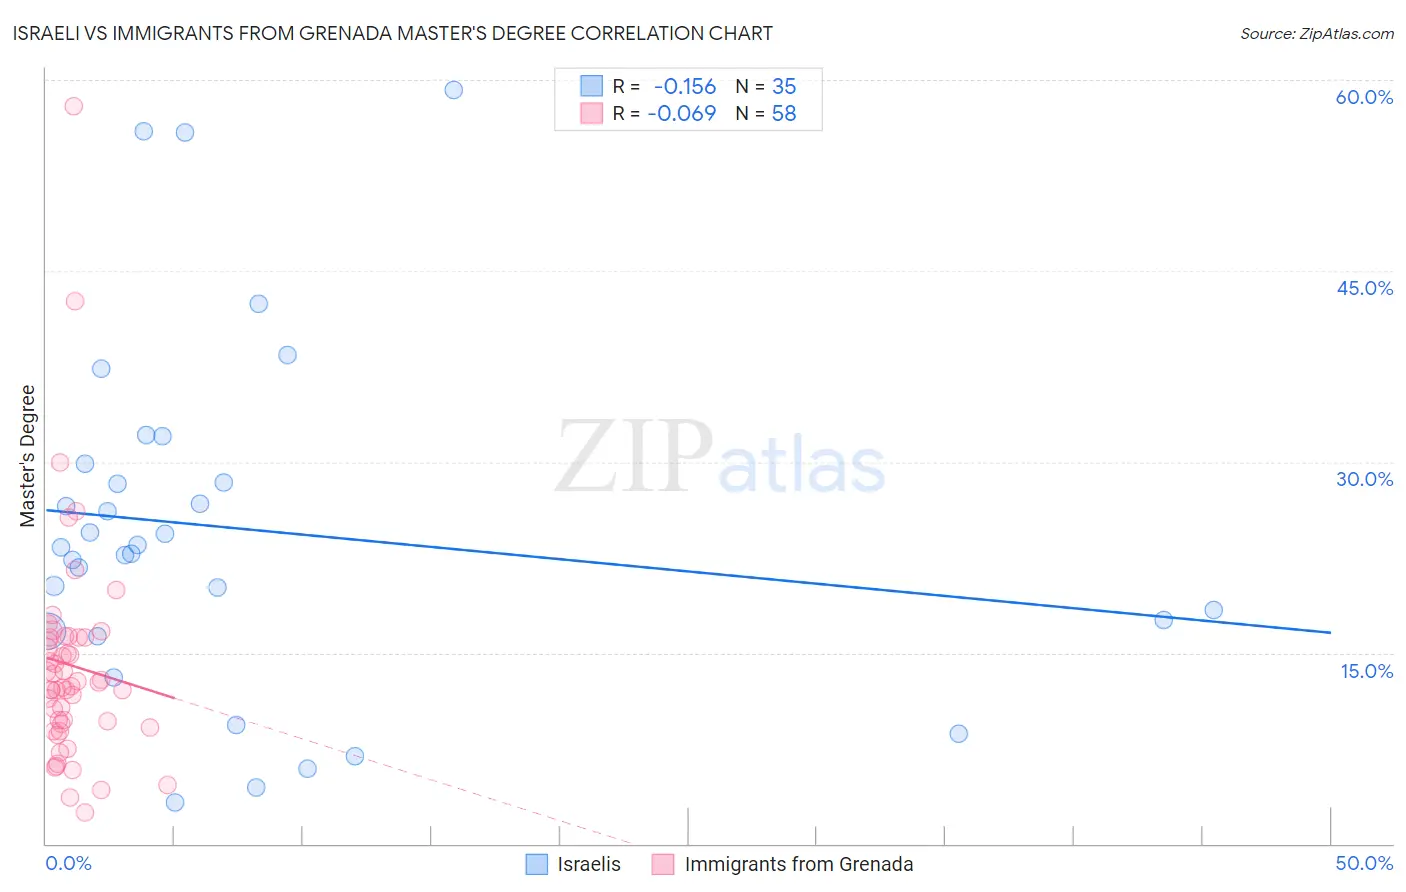
Israeli vs Immigrants from Grenada Master's Degree Correlation Chart

The statistical analysis conducted on geographies consisting of 211,131,712 people shows a poor negative correlation between the proportion of Israelis and percentage of population with at least master's degree education in the United States with a correlation coefficient (R) of -0.156 and weighted average of 20.3%. Similarly, the statistical analysis conducted on geographies consisting of 67,201,096 people shows a slight negative correlation between the proportion of Immigrants from Grenada and percentage of population with at least master's degree education in the United States with a correlation coefficient (R) of -0.069 and weighted average of 14.0%, a difference of 45.7%.
Israeli vs Immigrants from Grenada Master's Degree

Master's Degree Correlation Summary

MeasurementIsraeliImmigrants from Grenada
Minimum3.2%2.4%
Maximum59.3%57.9%
Range56.0%55.5%
Mean24.7%14.0%
Median23.3%12.5%
Interquartile 25% (IQ1)16.7%9.5%
Interquartile 75% (IQ3)29.9%16.2%
Interquartile Range (IQR)13.2%6.7%
Standard Deviation (Sample)13.8%8.9%
Standard Deviation (Population)13.6%8.8%

Similar Demographics by Master's Degree

Demographics Similar to Israelis by Master's Degree

In terms of master's degree, the demographic groups most similar to Israelis are Immigrants from France (20.3%, a difference of 0.28%), Immigrants from Sweden (20.3%, a difference of 0.35%), Immigrants from Ireland (20.4%, a difference of 0.42%), Indian (Asian) (20.5%, a difference of 0.53%), and Immigrants from Hong Kong (20.5%, a difference of 0.55%).
DemographicsRating | RankMaster's Degree
Immigrants | Eastern Asia
100.0
/100
|
#15
Exceptional
20.8%
Immigrants | Belgium
100.0
/100
|
#16
Exceptional
20.8%
Immigrants | South Central Asia
100.0
/100
|
#17
Exceptional
20.7%
Soviet Union
100.0
/100
|
#18
Exceptional
20.5%
Immigrants | Hong Kong
100.0
/100
|
#19
Exceptional
20.5%
Indians (Asian)
100.0
/100
|
#20
Exceptional
20.5%
Immigrants | Ireland
100.0
/100
|
#21
Exceptional
20.4%
Israelis
100.0
/100
|
#22
Exceptional
20.3%
Immigrants | France
100.0
/100
|
#23
Exceptional
20.3%
Immigrants | Sweden
100.0
/100
|
#24
Exceptional
20.3%
Immigrants | Japan
100.0
/100
|
#25
Exceptional
20.0%
Cambodians
100.0
/100
|
#26
Exceptional
20.0%
Immigrants | Sri Lanka
100.0
/100
|
#27
Exceptional
19.9%
Turks
100.0
/100
|
#28
Exceptional
19.9%
Latvians
100.0
/100
|
#29
Exceptional
19.8%

Demographics Similar to Immigrants from Grenada by Master's Degree

In terms of master's degree, the demographic groups most similar to Immigrants from Grenada are Immigrants from South Eastern Asia (14.0%, a difference of 0.050%), Portuguese (13.9%, a difference of 0.21%), Ecuadorian (14.0%, a difference of 0.25%), Immigrants from St. Vincent and the Grenadines (13.9%, a difference of 0.26%), and Korean (14.0%, a difference of 0.28%).
DemographicsRating | RankMaster's Degree
Immigrants | Trinidad and Tobago
15.8
/100
|
#217
Poor
14.1%
French Canadians
14.9
/100
|
#218
Poor
14.1%
Norwegians
13.6
/100
|
#219
Poor
14.0%
Germans
13.1
/100
|
#220
Poor
14.0%
Koreans
12.7
/100
|
#221
Poor
14.0%
Ecuadorians
12.6
/100
|
#222
Poor
14.0%
Immigrants | South Eastern Asia
11.9
/100
|
#223
Poor
14.0%
Immigrants | Grenada
11.8
/100
|
#224
Poor
14.0%
Portuguese
11.2
/100
|
#225
Poor
13.9%
Immigrants | St. Vincent and the Grenadines
11.0
/100
|
#226
Poor
13.9%
Immigrants | West Indies
9.8
/100
|
#227
Tragic
13.9%
Whites/Caucasians
9.1
/100
|
#228
Tragic
13.8%
British West Indians
8.8
/100
|
#229
Tragic
13.8%
Dutch
8.7
/100
|
#230
Tragic
13.8%
Guyanese
7.6
/100
|
#231
Tragic
13.7%