Immigrants from Cameroon vs Immigrants from Grenada Master's Degree
COMPARE
Immigrants from Cameroon
Immigrants from Grenada
Master's Degree
Master's Degree Comparison
Immigrants from Cameroon
Immigrants from Grenada
15.4%
MASTER'S DEGREE
71.7/ 100
METRIC RATING
157th/ 347
METRIC RANK
14.0%
MASTER'S DEGREE
11.8/ 100
METRIC RATING
224th/ 347
METRIC RANK
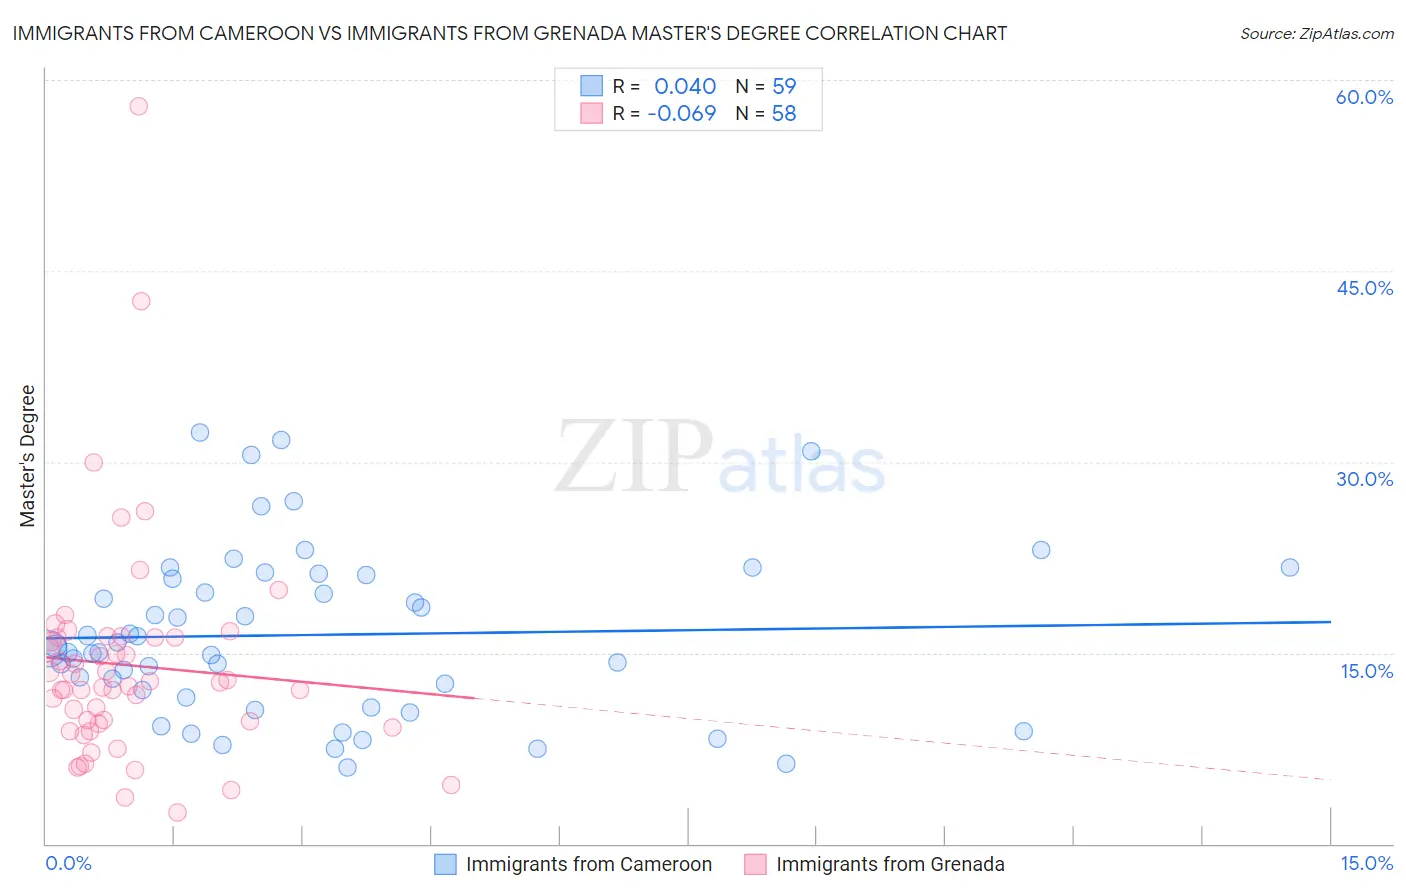
Immigrants from Cameroon vs Immigrants from Grenada Master's Degree Correlation Chart
The statistical analysis conducted on geographies consisting of 130,754,355 people shows no correlation between the proportion of Immigrants from Cameroon and percentage of population with at least master's degree education in the United States with a correlation coefficient (R) of 0.040 and weighted average of 15.4%. Similarly, the statistical analysis conducted on geographies consisting of 67,201,096 people shows a slight negative correlation between the proportion of Immigrants from Grenada and percentage of population with at least master's degree education in the United States with a correlation coefficient (R) of -0.069 and weighted average of 14.0%, a difference of 10.1%.
Master's Degree Correlation Summary
| Measurement | Immigrants from Cameroon | Immigrants from Grenada |
| Minimum | 6.0% | 2.4% |
| Maximum | 32.3% | 57.9% |
| Range | 26.3% | 55.5% |
| Mean | 16.4% | 14.0% |
| Median | 15.3% | 12.5% |
| Interquartile 25% (IQ1) | 11.5% | 9.5% |
| Interquartile 75% (IQ3) | 21.1% | 16.2% |
| Interquartile Range (IQR) | 9.5% | 6.7% |
| Standard Deviation (Sample) | 6.6% | 8.9% |
| Standard Deviation (Population) | 6.5% | 8.8% |
Similar Demographics by Master's Degree
Demographics Similar to Immigrants from Cameroon by Master's Degree
In terms of master's degree, the demographic groups most similar to Immigrants from Cameroon are Immigrants from Poland (15.4%, a difference of 0.040%), Luxembourger (15.3%, a difference of 0.11%), Kenyan (15.3%, a difference of 0.22%), Bermudan (15.4%, a difference of 0.35%), and Sudanese (15.3%, a difference of 0.45%).
| Demographics | Rating | Rank | Master's Degree |
| Slovenes | 78.0 /100 | #150 | Good 15.5% |
| Iraqis | 77.3 /100 | #151 | Good 15.5% |
| Slavs | 77.0 /100 | #152 | Good 15.5% |
| Icelanders | 76.8 /100 | #153 | Good 15.5% |
| Immigrants | South America | 76.3 /100 | #154 | Good 15.5% |
| Immigrants | Bangladesh | 76.1 /100 | #155 | Good 15.5% |
| Bermudans | 73.9 /100 | #156 | Good 15.4% |
| Immigrants | Cameroon | 71.7 /100 | #157 | Good 15.4% |
| Immigrants | Poland | 71.5 /100 | #158 | Good 15.4% |
| Luxembourgers | 71.0 /100 | #159 | Good 15.3% |
| Kenyans | 70.3 /100 | #160 | Good 15.3% |
| Sudanese | 68.7 /100 | #161 | Good 15.3% |
| Peruvians | 68.7 /100 | #162 | Good 15.3% |
| Uruguayans | 67.1 /100 | #163 | Good 15.3% |
| Colombians | 66.9 /100 | #164 | Good 15.3% |
Demographics Similar to Immigrants from Grenada by Master's Degree
In terms of master's degree, the demographic groups most similar to Immigrants from Grenada are Immigrants from South Eastern Asia (14.0%, a difference of 0.050%), Portuguese (13.9%, a difference of 0.21%), Ecuadorian (14.0%, a difference of 0.25%), Immigrants from St. Vincent and the Grenadines (13.9%, a difference of 0.26%), and Korean (14.0%, a difference of 0.28%).
| Demographics | Rating | Rank | Master's Degree |
| Immigrants | Trinidad and Tobago | 15.8 /100 | #217 | Poor 14.1% |
| French Canadians | 14.9 /100 | #218 | Poor 14.1% |
| Norwegians | 13.6 /100 | #219 | Poor 14.0% |
| Germans | 13.1 /100 | #220 | Poor 14.0% |
| Koreans | 12.7 /100 | #221 | Poor 14.0% |
| Ecuadorians | 12.6 /100 | #222 | Poor 14.0% |
| Immigrants | South Eastern Asia | 11.9 /100 | #223 | Poor 14.0% |
| Immigrants | Grenada | 11.8 /100 | #224 | Poor 14.0% |
| Portuguese | 11.2 /100 | #225 | Poor 13.9% |
| Immigrants | St. Vincent and the Grenadines | 11.0 /100 | #226 | Poor 13.9% |
| Immigrants | West Indies | 9.8 /100 | #227 | Tragic 13.9% |
| Whites/Caucasians | 9.1 /100 | #228 | Tragic 13.8% |
| British West Indians | 8.8 /100 | #229 | Tragic 13.8% |
| Dutch | 8.7 /100 | #230 | Tragic 13.8% |
| Guyanese | 7.6 /100 | #231 | Tragic 13.7% |