Immigrants vs Immigrants from Grenada Master's Degree
COMPARE
Immigrants
Immigrants from Grenada
Master's Degree
Master's Degree Comparison
Immigrants
Immigrants from Grenada
14.6%
MASTER'S DEGREE
36.0/ 100
METRIC RATING
189th/ 347
METRIC RANK
14.0%
MASTER'S DEGREE
11.8/ 100
METRIC RATING
224th/ 347
METRIC RANK
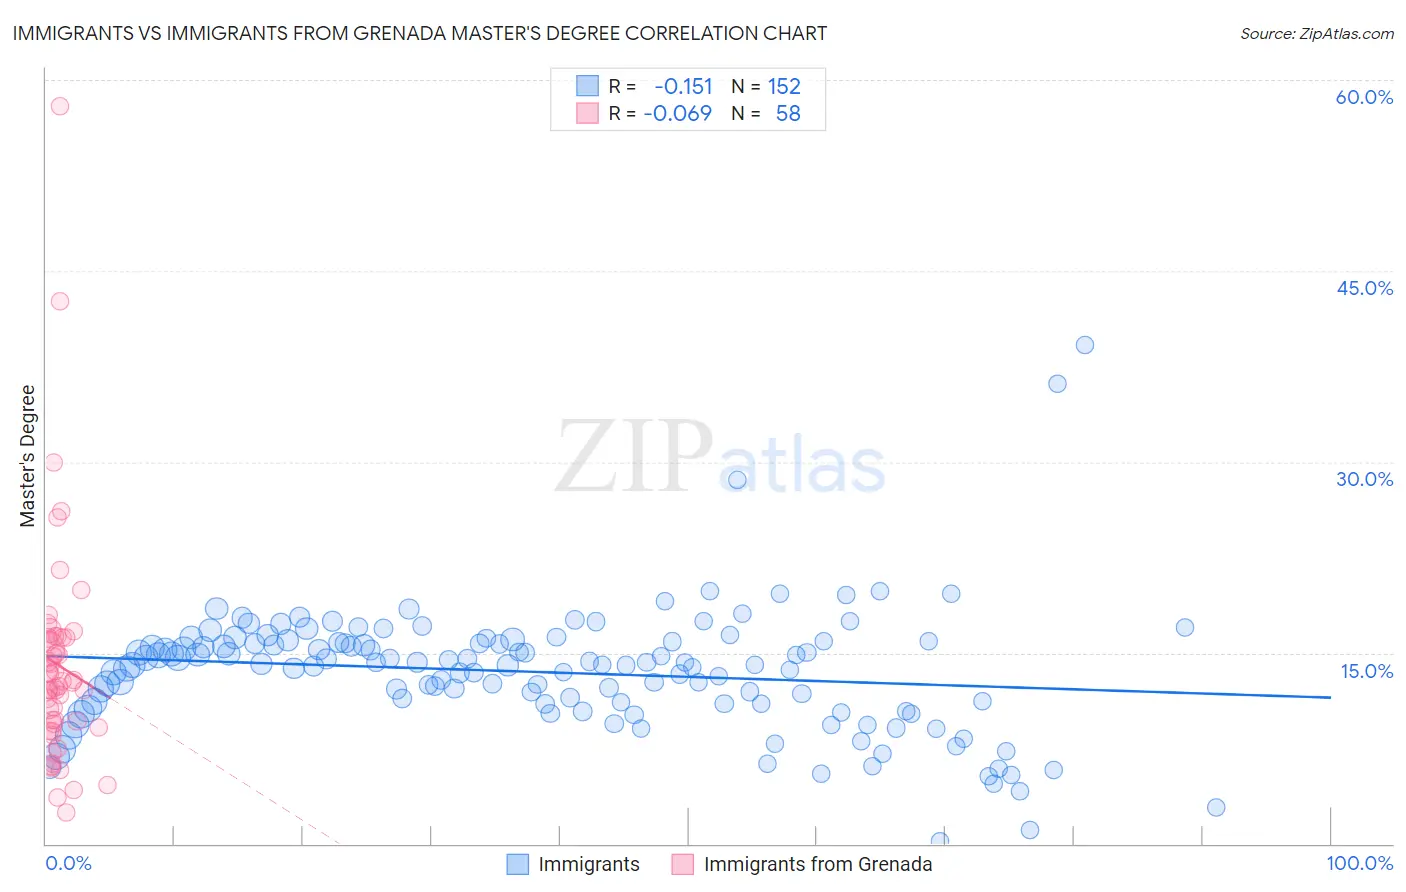
Immigrants vs Immigrants from Grenada Master's Degree Correlation Chart
The statistical analysis conducted on geographies consisting of 576,625,000 people shows a poor negative correlation between the proportion of Immigrants and percentage of population with at least master's degree education in the United States with a correlation coefficient (R) of -0.151 and weighted average of 14.6%. Similarly, the statistical analysis conducted on geographies consisting of 67,201,096 people shows a slight negative correlation between the proportion of Immigrants from Grenada and percentage of population with at least master's degree education in the United States with a correlation coefficient (R) of -0.069 and weighted average of 14.0%, a difference of 4.9%.
Master's Degree Correlation Summary
| Measurement | Immigrants | Immigrants from Grenada |
| Minimum | 0.15% | 2.4% |
| Maximum | 39.2% | 57.9% |
| Range | 39.0% | 55.5% |
| Mean | 13.5% | 14.0% |
| Median | 14.1% | 12.5% |
| Interquartile 25% (IQ1) | 11.0% | 9.5% |
| Interquartile 75% (IQ3) | 15.8% | 16.2% |
| Interquartile Range (IQR) | 4.9% | 6.7% |
| Standard Deviation (Sample) | 5.0% | 8.9% |
| Standard Deviation (Population) | 5.0% | 8.8% |
Similar Demographics by Master's Degree
Demographics Similar to Immigrants by Master's Degree
In terms of master's degree, the demographic groups most similar to Immigrants are Spaniard (14.6%, a difference of 0.020%), Immigrants from Costa Rica (14.7%, a difference of 0.040%), Basque (14.7%, a difference of 0.080%), Immigrants from Oceania (14.7%, a difference of 0.16%), and Welsh (14.6%, a difference of 0.25%).
| Demographics | Rating | Rank | Master's Degree |
| Czechs | 40.4 /100 | #182 | Average 14.7% |
| Sri Lankans | 39.6 /100 | #183 | Fair 14.7% |
| Immigrants | Zaire | 39.5 /100 | #184 | Fair 14.7% |
| Barbadians | 38.3 /100 | #185 | Fair 14.7% |
| Immigrants | Oceania | 37.1 /100 | #186 | Fair 14.7% |
| Basques | 36.5 /100 | #187 | Fair 14.7% |
| Immigrants | Costa Rica | 36.2 /100 | #188 | Fair 14.7% |
| Immigrants | Immigrants | 36.0 /100 | #189 | Fair 14.6% |
| Spaniards | 35.8 /100 | #190 | Fair 14.6% |
| Welsh | 34.2 /100 | #191 | Fair 14.6% |
| Immigrants | Middle Africa | 33.6 /100 | #192 | Fair 14.6% |
| Immigrants | Nigeria | 32.7 /100 | #193 | Fair 14.6% |
| Chinese | 32.5 /100 | #194 | Fair 14.6% |
| Danes | 31.3 /100 | #195 | Fair 14.5% |
| Czechoslovakians | 29.9 /100 | #196 | Fair 14.5% |
Demographics Similar to Immigrants from Grenada by Master's Degree
In terms of master's degree, the demographic groups most similar to Immigrants from Grenada are Immigrants from South Eastern Asia (14.0%, a difference of 0.050%), Portuguese (13.9%, a difference of 0.21%), Ecuadorian (14.0%, a difference of 0.25%), Immigrants from St. Vincent and the Grenadines (13.9%, a difference of 0.26%), and Korean (14.0%, a difference of 0.28%).
| Demographics | Rating | Rank | Master's Degree |
| Immigrants | Trinidad and Tobago | 15.8 /100 | #217 | Poor 14.1% |
| French Canadians | 14.9 /100 | #218 | Poor 14.1% |
| Norwegians | 13.6 /100 | #219 | Poor 14.0% |
| Germans | 13.1 /100 | #220 | Poor 14.0% |
| Koreans | 12.7 /100 | #221 | Poor 14.0% |
| Ecuadorians | 12.6 /100 | #222 | Poor 14.0% |
| Immigrants | South Eastern Asia | 11.9 /100 | #223 | Poor 14.0% |
| Immigrants | Grenada | 11.8 /100 | #224 | Poor 14.0% |
| Portuguese | 11.2 /100 | #225 | Poor 13.9% |
| Immigrants | St. Vincent and the Grenadines | 11.0 /100 | #226 | Poor 13.9% |
| Immigrants | West Indies | 9.8 /100 | #227 | Tragic 13.9% |
| Whites/Caucasians | 9.1 /100 | #228 | Tragic 13.8% |
| British West Indians | 8.8 /100 | #229 | Tragic 13.8% |
| Dutch | 8.7 /100 | #230 | Tragic 13.8% |
| Guyanese | 7.6 /100 | #231 | Tragic 13.7% |