Canadian vs Immigrants from Grenada Master's Degree
COMPARE
Canadian
Immigrants from Grenada
Master's Degree
Master's Degree Comparison
Canadians
Immigrants from Grenada
15.7%
MASTER'S DEGREE
83.3/ 100
METRIC RATING
144th/ 347
METRIC RANK
14.0%
MASTER'S DEGREE
11.8/ 100
METRIC RATING
224th/ 347
METRIC RANK
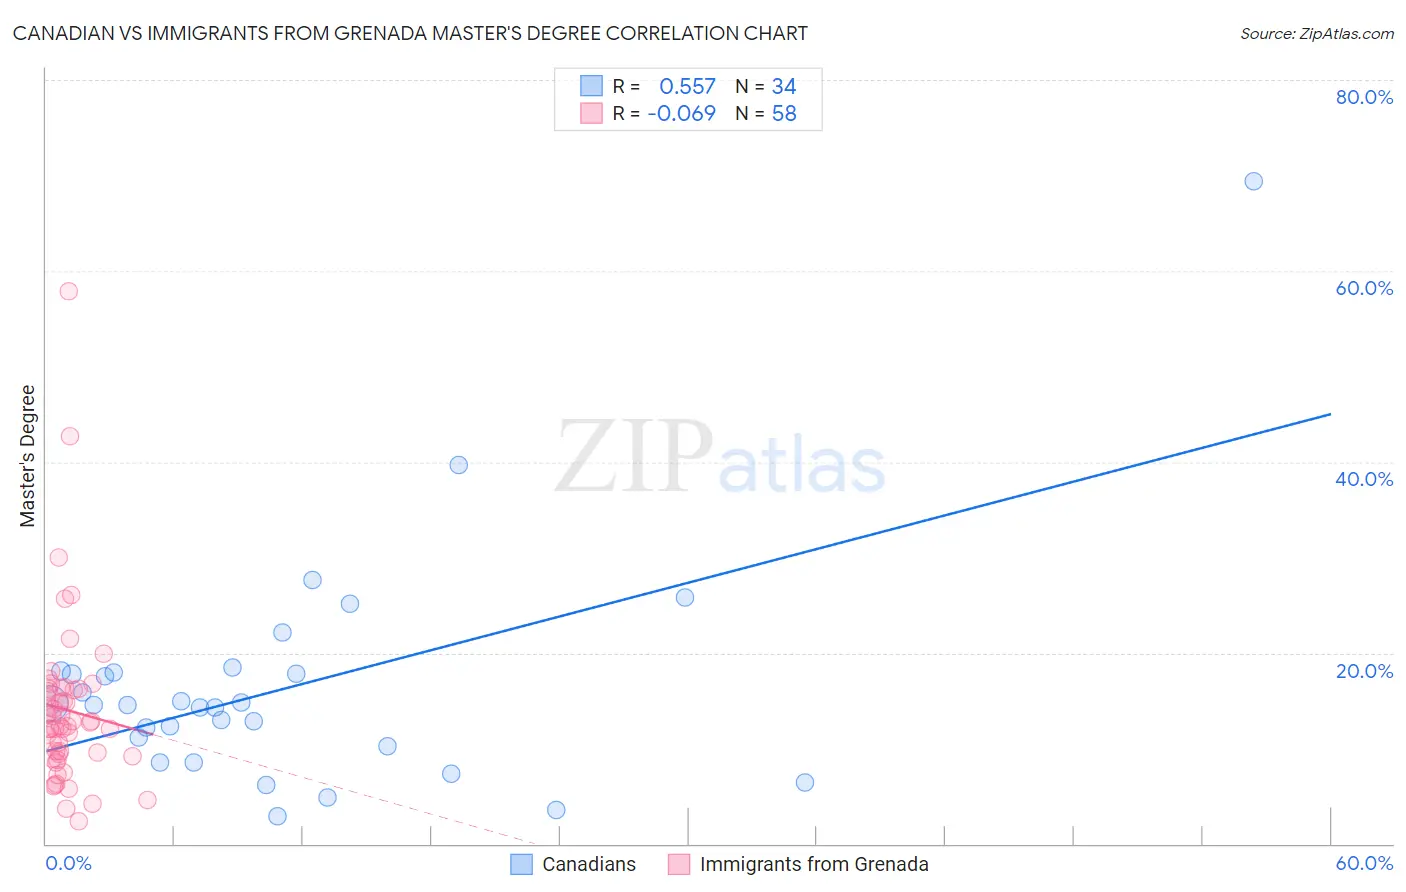
Canadian vs Immigrants from Grenada Master's Degree Correlation Chart
The statistical analysis conducted on geographies consisting of 437,396,402 people shows a substantial positive correlation between the proportion of Canadians and percentage of population with at least master's degree education in the United States with a correlation coefficient (R) of 0.557 and weighted average of 15.7%. Similarly, the statistical analysis conducted on geographies consisting of 67,201,096 people shows a slight negative correlation between the proportion of Immigrants from Grenada and percentage of population with at least master's degree education in the United States with a correlation coefficient (R) of -0.069 and weighted average of 14.0%, a difference of 12.4%.
Master's Degree Correlation Summary
| Measurement | Canadian | Immigrants from Grenada |
| Minimum | 2.8% | 2.4% |
| Maximum | 69.4% | 57.9% |
| Range | 66.6% | 55.5% |
| Mean | 16.3% | 14.0% |
| Median | 14.6% | 12.5% |
| Interquartile 25% (IQ1) | 10.2% | 9.5% |
| Interquartile 75% (IQ3) | 18.0% | 16.2% |
| Interquartile Range (IQR) | 7.8% | 6.7% |
| Standard Deviation (Sample) | 12.0% | 8.9% |
| Standard Deviation (Population) | 11.8% | 8.8% |
Similar Demographics by Master's Degree
Demographics Similar to Canadians by Master's Degree
In terms of master's degree, the demographic groups most similar to Canadians are Immigrants from Venezuela (15.7%, a difference of 0.080%), Immigrants from Africa (15.7%, a difference of 0.17%), Polish (15.7%, a difference of 0.40%), South American (15.6%, a difference of 0.42%), and Vietnamese (15.8%, a difference of 0.53%).
| Demographics | Rating | Rank | Master's Degree |
| Europeans | 86.4 /100 | #137 | Excellent 15.8% |
| Pakistanis | 86.1 /100 | #138 | Excellent 15.8% |
| Immigrants | Germany | 85.9 /100 | #139 | Excellent 15.8% |
| Vietnamese | 85.5 /100 | #140 | Excellent 15.8% |
| Poles | 85.0 /100 | #141 | Excellent 15.7% |
| Immigrants | Africa | 84.0 /100 | #142 | Excellent 15.7% |
| Immigrants | Venezuela | 83.6 /100 | #143 | Excellent 15.7% |
| Canadians | 83.3 /100 | #144 | Excellent 15.7% |
| South Americans | 81.3 /100 | #145 | Excellent 15.6% |
| Immigrants | Afghanistan | 79.4 /100 | #146 | Good 15.6% |
| Hungarians | 79.1 /100 | #147 | Good 15.6% |
| Immigrants | Senegal | 78.2 /100 | #148 | Good 15.5% |
| Ghanaians | 78.2 /100 | #149 | Good 15.5% |
| Slovenes | 78.0 /100 | #150 | Good 15.5% |
| Iraqis | 77.3 /100 | #151 | Good 15.5% |
Demographics Similar to Immigrants from Grenada by Master's Degree
In terms of master's degree, the demographic groups most similar to Immigrants from Grenada are Immigrants from South Eastern Asia (14.0%, a difference of 0.050%), Portuguese (13.9%, a difference of 0.21%), Ecuadorian (14.0%, a difference of 0.25%), Immigrants from St. Vincent and the Grenadines (13.9%, a difference of 0.26%), and Korean (14.0%, a difference of 0.28%).
| Demographics | Rating | Rank | Master's Degree |
| Immigrants | Trinidad and Tobago | 15.8 /100 | #217 | Poor 14.1% |
| French Canadians | 14.9 /100 | #218 | Poor 14.1% |
| Norwegians | 13.6 /100 | #219 | Poor 14.0% |
| Germans | 13.1 /100 | #220 | Poor 14.0% |
| Koreans | 12.7 /100 | #221 | Poor 14.0% |
| Ecuadorians | 12.6 /100 | #222 | Poor 14.0% |
| Immigrants | South Eastern Asia | 11.9 /100 | #223 | Poor 14.0% |
| Immigrants | Grenada | 11.8 /100 | #224 | Poor 14.0% |
| Portuguese | 11.2 /100 | #225 | Poor 13.9% |
| Immigrants | St. Vincent and the Grenadines | 11.0 /100 | #226 | Poor 13.9% |
| Immigrants | West Indies | 9.8 /100 | #227 | Tragic 13.9% |
| Whites/Caucasians | 9.1 /100 | #228 | Tragic 13.8% |
| British West Indians | 8.8 /100 | #229 | Tragic 13.8% |
| Dutch | 8.7 /100 | #230 | Tragic 13.8% |
| Guyanese | 7.6 /100 | #231 | Tragic 13.7% |