Yuman vs Immigrants from Grenada Master's Degree
COMPARE
Yuman
Immigrants from Grenada
Master's Degree
Master's Degree Comparison
Yuman
Immigrants from Grenada
9.2%
MASTER'S DEGREE
0.0/ 100
METRIC RATING
345th/ 347
METRIC RANK
14.0%
MASTER'S DEGREE
11.8/ 100
METRIC RATING
224th/ 347
METRIC RANK
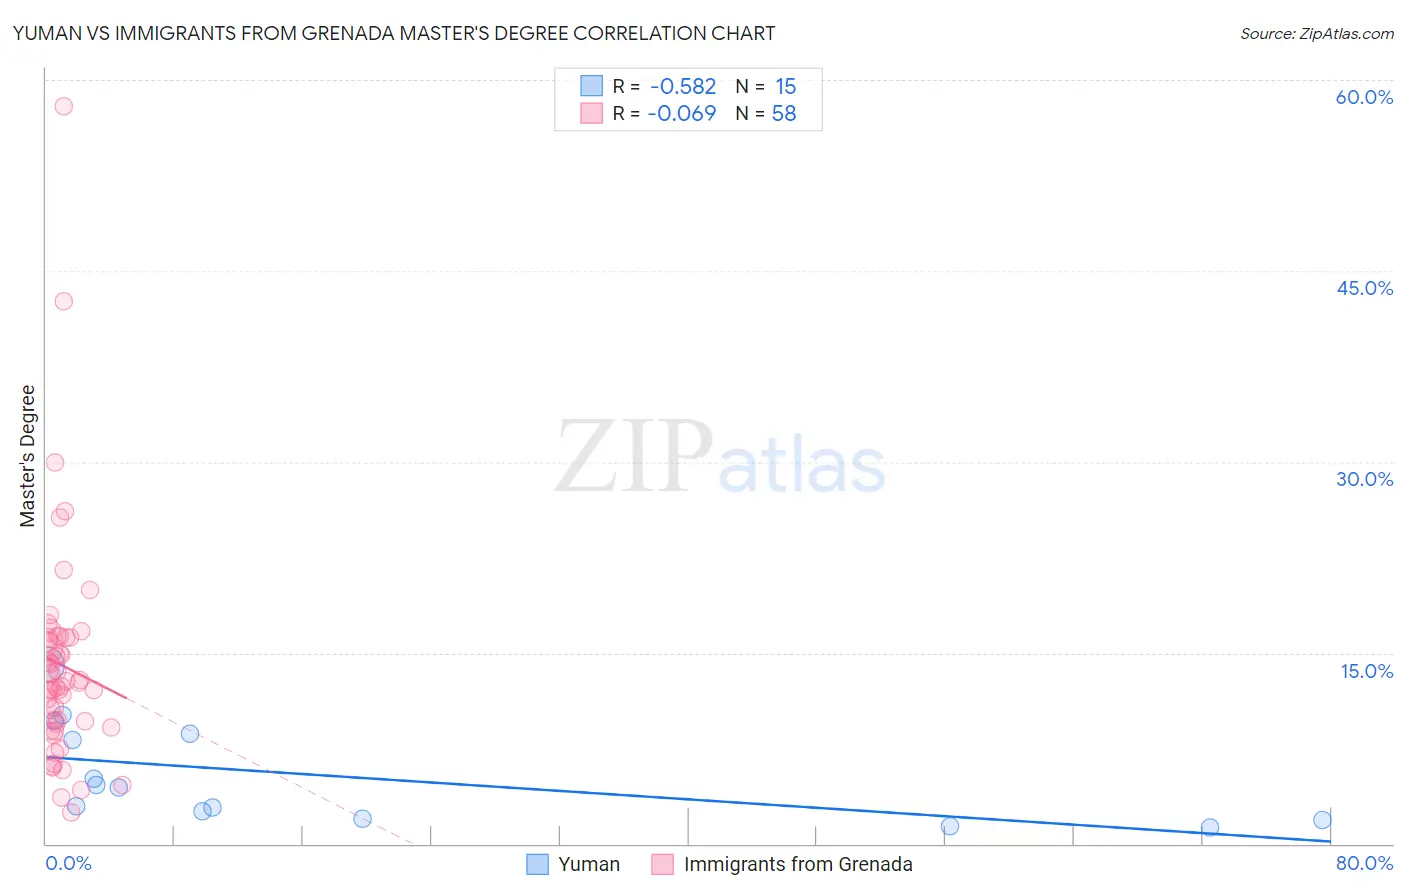
Yuman vs Immigrants from Grenada Master's Degree Correlation Chart
The statistical analysis conducted on geographies consisting of 40,680,215 people shows a substantial negative correlation between the proportion of Yuman and percentage of population with at least master's degree education in the United States with a correlation coefficient (R) of -0.582 and weighted average of 9.2%. Similarly, the statistical analysis conducted on geographies consisting of 67,201,096 people shows a slight negative correlation between the proportion of Immigrants from Grenada and percentage of population with at least master's degree education in the United States with a correlation coefficient (R) of -0.069 and weighted average of 14.0%, a difference of 51.2%.
Master's Degree Correlation Summary
| Measurement | Yuman | Immigrants from Grenada |
| Minimum | 1.3% | 2.4% |
| Maximum | 14.1% | 57.9% |
| Range | 12.8% | 55.5% |
| Mean | 5.3% | 14.0% |
| Median | 4.4% | 12.5% |
| Interquartile 25% (IQ1) | 1.9% | 9.5% |
| Interquartile 75% (IQ3) | 8.6% | 16.2% |
| Interquartile Range (IQR) | 6.7% | 6.7% |
| Standard Deviation (Sample) | 3.9% | 8.9% |
| Standard Deviation (Population) | 3.8% | 8.8% |
Similar Demographics by Master's Degree
Demographics Similar to Yuman by Master's Degree
In terms of master's degree, the demographic groups most similar to Yuman are Pima (9.2%, a difference of 0.15%), Lumbee (9.3%, a difference of 0.32%), Immigrants from Mexico (9.3%, a difference of 0.81%), Navajo (9.4%, a difference of 2.1%), and Yakama (9.5%, a difference of 2.5%).
| Demographics | Rating | Rank | Master's Degree |
| Menominee | 0.0 /100 | #333 | Tragic 10.2% |
| Arapaho | 0.0 /100 | #334 | Tragic 10.0% |
| Immigrants | Central America | 0.0 /100 | #335 | Tragic 10.0% |
| Natives/Alaskans | 0.0 /100 | #336 | Tragic 9.9% |
| Mexicans | 0.0 /100 | #337 | Tragic 9.7% |
| Tohono O'odham | 0.0 /100 | #338 | Tragic 9.7% |
| Spanish American Indians | 0.0 /100 | #339 | Tragic 9.6% |
| Yakama | 0.0 /100 | #340 | Tragic 9.5% |
| Navajo | 0.0 /100 | #341 | Tragic 9.4% |
| Immigrants | Mexico | 0.0 /100 | #342 | Tragic 9.3% |
| Lumbee | 0.0 /100 | #343 | Tragic 9.3% |
| Pima | 0.0 /100 | #344 | Tragic 9.2% |
| Yuman | 0.0 /100 | #345 | Tragic 9.2% |
| Yup'ik | 0.0 /100 | #346 | Tragic 8.5% |
| Houma | 0.0 /100 | #347 | Tragic 7.9% |
Demographics Similar to Immigrants from Grenada by Master's Degree
In terms of master's degree, the demographic groups most similar to Immigrants from Grenada are Immigrants from South Eastern Asia (14.0%, a difference of 0.050%), Portuguese (13.9%, a difference of 0.21%), Ecuadorian (14.0%, a difference of 0.25%), Immigrants from St. Vincent and the Grenadines (13.9%, a difference of 0.26%), and Korean (14.0%, a difference of 0.28%).
| Demographics | Rating | Rank | Master's Degree |
| Immigrants | Trinidad and Tobago | 15.8 /100 | #217 | Poor 14.1% |
| French Canadians | 14.9 /100 | #218 | Poor 14.1% |
| Norwegians | 13.6 /100 | #219 | Poor 14.0% |
| Germans | 13.1 /100 | #220 | Poor 14.0% |
| Koreans | 12.7 /100 | #221 | Poor 14.0% |
| Ecuadorians | 12.6 /100 | #222 | Poor 14.0% |
| Immigrants | South Eastern Asia | 11.9 /100 | #223 | Poor 14.0% |
| Immigrants | Grenada | 11.8 /100 | #224 | Poor 14.0% |
| Portuguese | 11.2 /100 | #225 | Poor 13.9% |
| Immigrants | St. Vincent and the Grenadines | 11.0 /100 | #226 | Poor 13.9% |
| Immigrants | West Indies | 9.8 /100 | #227 | Tragic 13.9% |
| Whites/Caucasians | 9.1 /100 | #228 | Tragic 13.8% |
| British West Indians | 8.8 /100 | #229 | Tragic 13.8% |
| Dutch | 8.7 /100 | #230 | Tragic 13.8% |
| Guyanese | 7.6 /100 | #231 | Tragic 13.7% |