Puerto Rican vs Estonian Master's Degree
COMPARE
Puerto Rican
Estonian
Master's Degree
Master's Degree Comparison
Puerto Ricans
Estonians
11.2%
MASTER'S DEGREE
0.0/ 100
METRIC RATING
308th/ 347
METRIC RANK
18.8%
MASTER'S DEGREE
100.0/ 100
METRIC RATING
49th/ 347
METRIC RANK
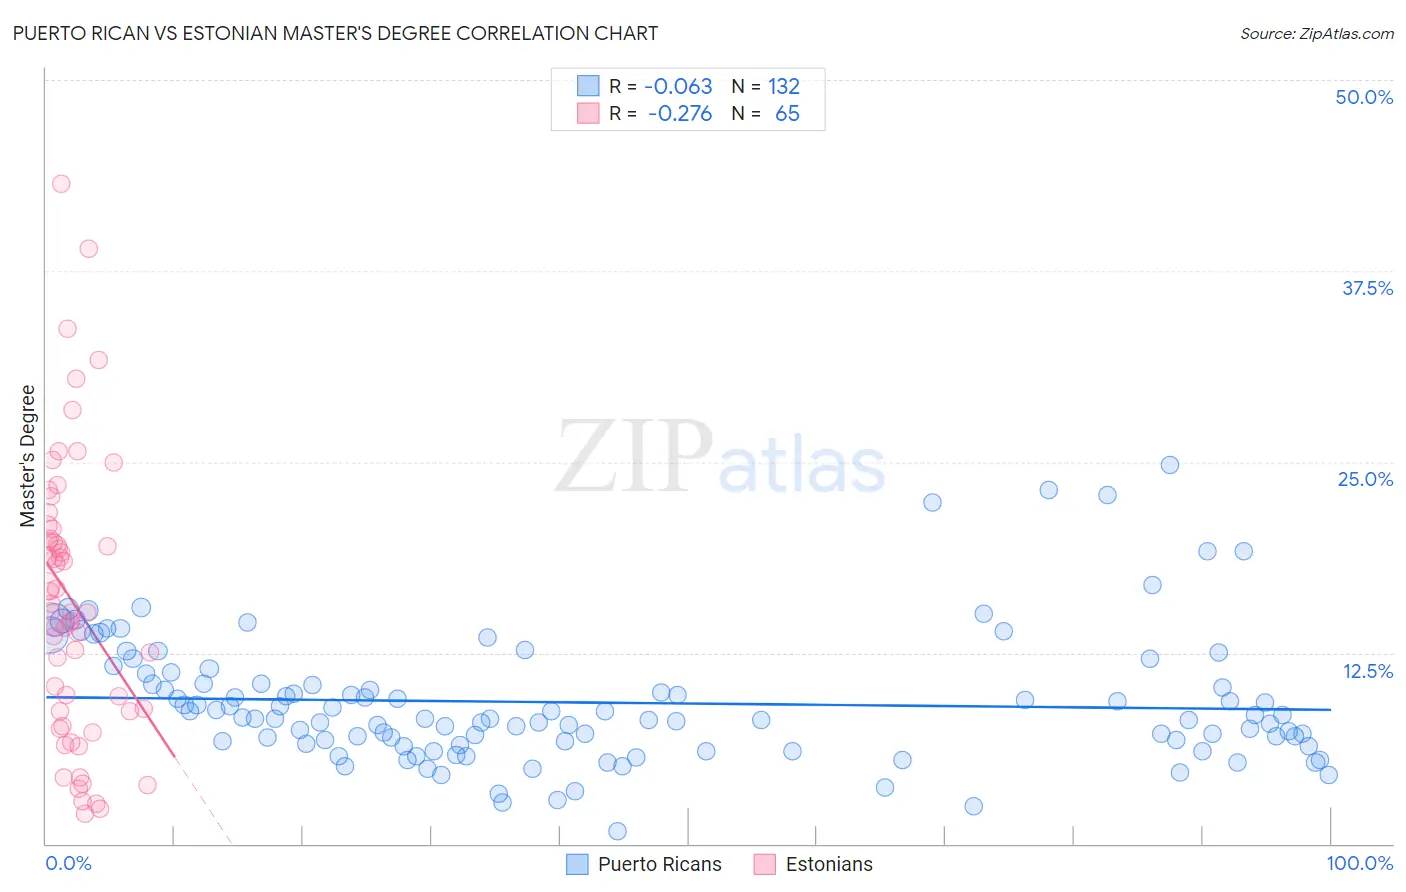
Puerto Rican vs Estonian Master's Degree Correlation Chart
The statistical analysis conducted on geographies consisting of 527,764,929 people shows a slight negative correlation between the proportion of Puerto Ricans and percentage of population with at least master's degree education in the United States with a correlation coefficient (R) of -0.063 and weighted average of 11.2%. Similarly, the statistical analysis conducted on geographies consisting of 123,509,943 people shows a weak negative correlation between the proportion of Estonians and percentage of population with at least master's degree education in the United States with a correlation coefficient (R) of -0.276 and weighted average of 18.8%, a difference of 68.2%.
Master's Degree Correlation Summary
| Measurement | Puerto Rican | Estonian |
| Minimum | 0.86% | 2.0% |
| Maximum | 24.8% | 43.2% |
| Range | 23.9% | 41.2% |
| Mean | 9.2% | 15.9% |
| Median | 8.2% | 15.2% |
| Interquartile 25% (IQ1) | 6.6% | 8.7% |
| Interquartile 75% (IQ3) | 10.8% | 20.3% |
| Interquartile Range (IQR) | 4.2% | 11.6% |
| Standard Deviation (Sample) | 4.2% | 9.0% |
| Standard Deviation (Population) | 4.2% | 8.9% |
Similar Demographics by Master's Degree
Demographics Similar to Puerto Ricans by Master's Degree
In terms of master's degree, the demographic groups most similar to Puerto Ricans are Puget Sound Salish (11.1%, a difference of 0.29%), Cheyenne (11.2%, a difference of 0.55%), Shoshone (11.1%, a difference of 0.65%), Mexican American Indian (11.2%, a difference of 0.70%), and Immigrants from Latin America (11.3%, a difference of 0.89%).
| Demographics | Rating | Rank | Master's Degree |
| Tsimshian | 0.1 /100 | #301 | Tragic 11.4% |
| Cherokee | 0.1 /100 | #302 | Tragic 11.4% |
| Immigrants | Laos | 0.1 /100 | #303 | Tragic 11.4% |
| Immigrants | Cabo Verde | 0.1 /100 | #304 | Tragic 11.3% |
| Immigrants | Latin America | 0.0 /100 | #305 | Tragic 11.3% |
| Mexican American Indians | 0.0 /100 | #306 | Tragic 11.2% |
| Cheyenne | 0.0 /100 | #307 | Tragic 11.2% |
| Puerto Ricans | 0.0 /100 | #308 | Tragic 11.2% |
| Puget Sound Salish | 0.0 /100 | #309 | Tragic 11.1% |
| Shoshone | 0.0 /100 | #310 | Tragic 11.1% |
| Seminole | 0.0 /100 | #311 | Tragic 11.0% |
| Choctaw | 0.0 /100 | #312 | Tragic 11.0% |
| Yaqui | 0.0 /100 | #313 | Tragic 11.0% |
| Cajuns | 0.0 /100 | #314 | Tragic 11.0% |
| Apache | 0.0 /100 | #315 | Tragic 11.0% |
Demographics Similar to Estonians by Master's Degree
In terms of master's degree, the demographic groups most similar to Estonians are Paraguayan (18.8%, a difference of 0.10%), Immigrants from Austria (18.8%, a difference of 0.16%), Immigrants from Norway (18.8%, a difference of 0.17%), Bulgarian (18.8%, a difference of 0.19%), and Immigrants from South Africa (18.8%, a difference of 0.20%).
| Demographics | Rating | Rank | Master's Degree |
| Immigrants | Saudi Arabia | 100.0 /100 | #42 | Exceptional 19.0% |
| Immigrants | Greece | 100.0 /100 | #43 | Exceptional 19.0% |
| Immigrants | Malaysia | 100.0 /100 | #44 | Exceptional 18.9% |
| Immigrants | Belarus | 100.0 /100 | #45 | Exceptional 18.9% |
| Immigrants | Norway | 100.0 /100 | #46 | Exceptional 18.8% |
| Immigrants | Austria | 100.0 /100 | #47 | Exceptional 18.8% |
| Paraguayans | 100.0 /100 | #48 | Exceptional 18.8% |
| Estonians | 100.0 /100 | #49 | Exceptional 18.8% |
| Bulgarians | 100.0 /100 | #50 | Exceptional 18.8% |
| Immigrants | South Africa | 100.0 /100 | #51 | Exceptional 18.8% |
| Immigrants | Kuwait | 100.0 /100 | #52 | Exceptional 18.6% |
| Immigrants | Czechoslovakia | 99.9 /100 | #53 | Exceptional 18.5% |
| Immigrants | Lithuania | 99.9 /100 | #54 | Exceptional 18.5% |
| Immigrants | Serbia | 99.9 /100 | #55 | Exceptional 18.5% |
| Asians | 99.9 /100 | #56 | Exceptional 18.4% |