Immigrants from Middle Africa vs Estonian Master's Degree
COMPARE
Immigrants from Middle Africa
Estonian
Master's Degree
Master's Degree Comparison
Immigrants from Middle Africa
Estonians
14.6%
MASTER'S DEGREE
33.6/ 100
METRIC RATING
192nd/ 347
METRIC RANK
18.8%
MASTER'S DEGREE
100.0/ 100
METRIC RATING
49th/ 347
METRIC RANK
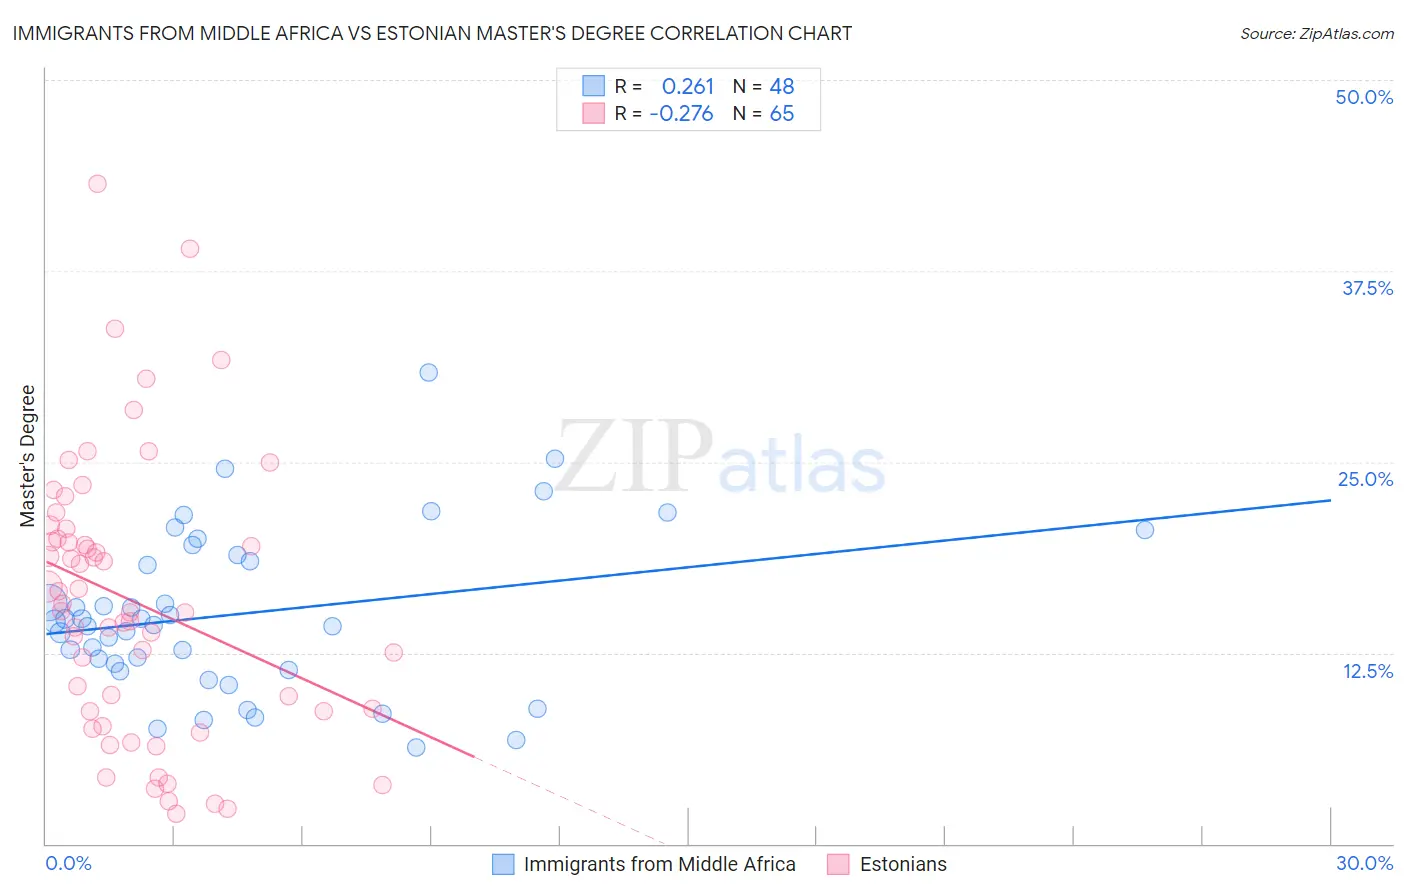
Immigrants from Middle Africa vs Estonian Master's Degree Correlation Chart
The statistical analysis conducted on geographies consisting of 202,718,309 people shows a weak positive correlation between the proportion of Immigrants from Middle Africa and percentage of population with at least master's degree education in the United States with a correlation coefficient (R) of 0.261 and weighted average of 14.6%. Similarly, the statistical analysis conducted on geographies consisting of 123,509,943 people shows a weak negative correlation between the proportion of Estonians and percentage of population with at least master's degree education in the United States with a correlation coefficient (R) of -0.276 and weighted average of 18.8%, a difference of 28.7%.
Master's Degree Correlation Summary
| Measurement | Immigrants from Middle Africa | Estonian |
| Minimum | 6.3% | 2.0% |
| Maximum | 30.8% | 43.2% |
| Range | 24.5% | 41.2% |
| Mean | 15.0% | 15.9% |
| Median | 14.5% | 15.2% |
| Interquartile 25% (IQ1) | 11.6% | 8.7% |
| Interquartile 75% (IQ3) | 18.7% | 20.3% |
| Interquartile Range (IQR) | 7.1% | 11.6% |
| Standard Deviation (Sample) | 5.3% | 9.0% |
| Standard Deviation (Population) | 5.2% | 8.9% |
Similar Demographics by Master's Degree
Demographics Similar to Immigrants from Middle Africa by Master's Degree
In terms of master's degree, the demographic groups most similar to Immigrants from Middle Africa are Welsh (14.6%, a difference of 0.090%), Immigrants from Nigeria (14.6%, a difference of 0.13%), Chinese (14.6%, a difference of 0.17%), Spaniard (14.6%, a difference of 0.31%), and Immigrants (14.6%, a difference of 0.34%).
| Demographics | Rating | Rank | Master's Degree |
| Barbadians | 38.3 /100 | #185 | Fair 14.7% |
| Immigrants | Oceania | 37.1 /100 | #186 | Fair 14.7% |
| Basques | 36.5 /100 | #187 | Fair 14.7% |
| Immigrants | Costa Rica | 36.2 /100 | #188 | Fair 14.7% |
| Immigrants | Immigrants | 36.0 /100 | #189 | Fair 14.6% |
| Spaniards | 35.8 /100 | #190 | Fair 14.6% |
| Welsh | 34.2 /100 | #191 | Fair 14.6% |
| Immigrants | Middle Africa | 33.6 /100 | #192 | Fair 14.6% |
| Immigrants | Nigeria | 32.7 /100 | #193 | Fair 14.6% |
| Chinese | 32.5 /100 | #194 | Fair 14.6% |
| Danes | 31.3 /100 | #195 | Fair 14.5% |
| Czechoslovakians | 29.9 /100 | #196 | Fair 14.5% |
| Belgians | 28.0 /100 | #197 | Fair 14.5% |
| West Indians | 27.4 /100 | #198 | Fair 14.5% |
| Immigrants | Armenia | 27.2 /100 | #199 | Fair 14.5% |
Demographics Similar to Estonians by Master's Degree
In terms of master's degree, the demographic groups most similar to Estonians are Paraguayan (18.8%, a difference of 0.10%), Immigrants from Austria (18.8%, a difference of 0.16%), Immigrants from Norway (18.8%, a difference of 0.17%), Bulgarian (18.8%, a difference of 0.19%), and Immigrants from South Africa (18.8%, a difference of 0.20%).
| Demographics | Rating | Rank | Master's Degree |
| Immigrants | Saudi Arabia | 100.0 /100 | #42 | Exceptional 19.0% |
| Immigrants | Greece | 100.0 /100 | #43 | Exceptional 19.0% |
| Immigrants | Malaysia | 100.0 /100 | #44 | Exceptional 18.9% |
| Immigrants | Belarus | 100.0 /100 | #45 | Exceptional 18.9% |
| Immigrants | Norway | 100.0 /100 | #46 | Exceptional 18.8% |
| Immigrants | Austria | 100.0 /100 | #47 | Exceptional 18.8% |
| Paraguayans | 100.0 /100 | #48 | Exceptional 18.8% |
| Estonians | 100.0 /100 | #49 | Exceptional 18.8% |
| Bulgarians | 100.0 /100 | #50 | Exceptional 18.8% |
| Immigrants | South Africa | 100.0 /100 | #51 | Exceptional 18.8% |
| Immigrants | Kuwait | 100.0 /100 | #52 | Exceptional 18.6% |
| Immigrants | Czechoslovakia | 99.9 /100 | #53 | Exceptional 18.5% |
| Immigrants | Lithuania | 99.9 /100 | #54 | Exceptional 18.5% |
| Immigrants | Serbia | 99.9 /100 | #55 | Exceptional 18.5% |
| Asians | 99.9 /100 | #56 | Exceptional 18.4% |