Immigrants from Trinidad and Tobago vs Estonian Master's Degree
COMPARE
Immigrants from Trinidad and Tobago
Estonian
Master's Degree
Master's Degree Comparison
Immigrants from Trinidad and Tobago
Estonians
14.1%
MASTER'S DEGREE
15.8/ 100
METRIC RATING
217th/ 347
METRIC RANK
18.8%
MASTER'S DEGREE
100.0/ 100
METRIC RATING
49th/ 347
METRIC RANK
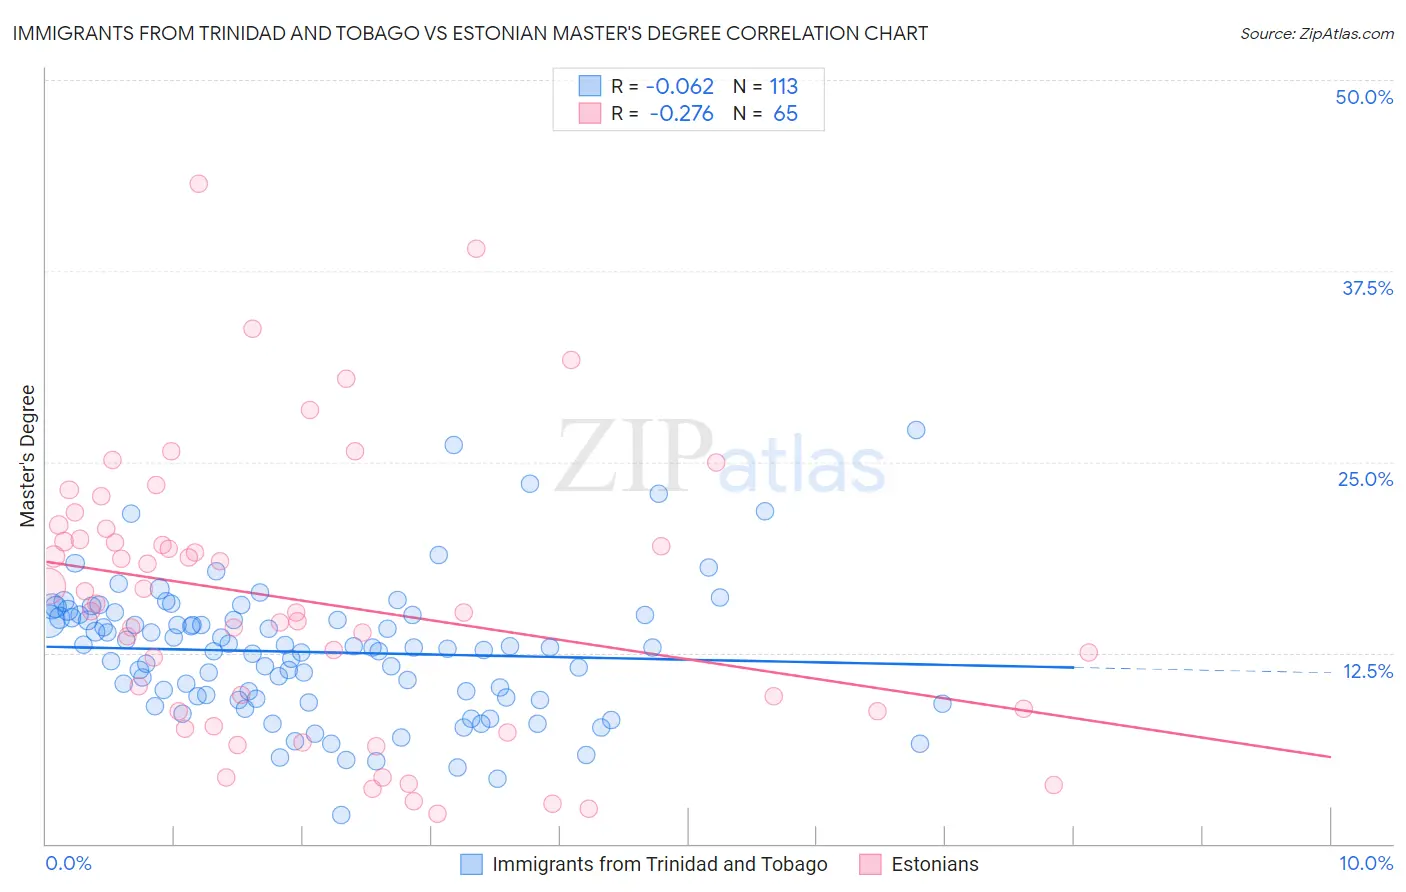
Immigrants from Trinidad and Tobago vs Estonian Master's Degree Correlation Chart
The statistical analysis conducted on geographies consisting of 223,499,592 people shows a slight negative correlation between the proportion of Immigrants from Trinidad and Tobago and percentage of population with at least master's degree education in the United States with a correlation coefficient (R) of -0.062 and weighted average of 14.1%. Similarly, the statistical analysis conducted on geographies consisting of 123,509,943 people shows a weak negative correlation between the proportion of Estonians and percentage of population with at least master's degree education in the United States with a correlation coefficient (R) of -0.276 and weighted average of 18.8%, a difference of 33.1%.
Master's Degree Correlation Summary
| Measurement | Immigrants from Trinidad and Tobago | Estonian |
| Minimum | 1.9% | 2.0% |
| Maximum | 27.1% | 43.2% |
| Range | 25.2% | 41.2% |
| Mean | 12.5% | 15.9% |
| Median | 12.8% | 15.2% |
| Interquartile 25% (IQ1) | 9.5% | 8.7% |
| Interquartile 75% (IQ3) | 14.9% | 20.3% |
| Interquartile Range (IQR) | 5.4% | 11.6% |
| Standard Deviation (Sample) | 4.3% | 9.0% |
| Standard Deviation (Population) | 4.3% | 8.9% |
Similar Demographics by Master's Degree
Demographics Similar to Immigrants from Trinidad and Tobago by Master's Degree
In terms of master's degree, the demographic groups most similar to Immigrants from Trinidad and Tobago are Immigrants from Somalia (14.1%, a difference of 0.0%), Immigrants from Vietnam (14.1%, a difference of 0.070%), French Canadian (14.1%, a difference of 0.25%), Finnish (14.2%, a difference of 0.28%), and Immigrants from Thailand (14.2%, a difference of 0.29%).
| Demographics | Rating | Rank | Master's Degree |
| Sub-Saharan Africans | 19.4 /100 | #210 | Poor 14.2% |
| Somalis | 18.0 /100 | #211 | Poor 14.2% |
| Spanish | 17.8 /100 | #212 | Poor 14.2% |
| Immigrants | Thailand | 17.0 /100 | #213 | Poor 14.2% |
| Finns | 16.9 /100 | #214 | Poor 14.2% |
| Immigrants | Vietnam | 16.1 /100 | #215 | Poor 14.1% |
| Immigrants | Somalia | 15.8 /100 | #216 | Poor 14.1% |
| Immigrants | Trinidad and Tobago | 15.8 /100 | #217 | Poor 14.1% |
| French Canadians | 14.9 /100 | #218 | Poor 14.1% |
| Norwegians | 13.6 /100 | #219 | Poor 14.0% |
| Germans | 13.1 /100 | #220 | Poor 14.0% |
| Koreans | 12.7 /100 | #221 | Poor 14.0% |
| Ecuadorians | 12.6 /100 | #222 | Poor 14.0% |
| Immigrants | South Eastern Asia | 11.9 /100 | #223 | Poor 14.0% |
| Immigrants | Grenada | 11.8 /100 | #224 | Poor 14.0% |
Demographics Similar to Estonians by Master's Degree
In terms of master's degree, the demographic groups most similar to Estonians are Paraguayan (18.8%, a difference of 0.10%), Immigrants from Austria (18.8%, a difference of 0.16%), Immigrants from Norway (18.8%, a difference of 0.17%), Bulgarian (18.8%, a difference of 0.19%), and Immigrants from South Africa (18.8%, a difference of 0.20%).
| Demographics | Rating | Rank | Master's Degree |
| Immigrants | Saudi Arabia | 100.0 /100 | #42 | Exceptional 19.0% |
| Immigrants | Greece | 100.0 /100 | #43 | Exceptional 19.0% |
| Immigrants | Malaysia | 100.0 /100 | #44 | Exceptional 18.9% |
| Immigrants | Belarus | 100.0 /100 | #45 | Exceptional 18.9% |
| Immigrants | Norway | 100.0 /100 | #46 | Exceptional 18.8% |
| Immigrants | Austria | 100.0 /100 | #47 | Exceptional 18.8% |
| Paraguayans | 100.0 /100 | #48 | Exceptional 18.8% |
| Estonians | 100.0 /100 | #49 | Exceptional 18.8% |
| Bulgarians | 100.0 /100 | #50 | Exceptional 18.8% |
| Immigrants | South Africa | 100.0 /100 | #51 | Exceptional 18.8% |
| Immigrants | Kuwait | 100.0 /100 | #52 | Exceptional 18.6% |
| Immigrants | Czechoslovakia | 99.9 /100 | #53 | Exceptional 18.5% |
| Immigrants | Lithuania | 99.9 /100 | #54 | Exceptional 18.5% |
| Immigrants | Serbia | 99.9 /100 | #55 | Exceptional 18.5% |
| Asians | 99.9 /100 | #56 | Exceptional 18.4% |