Crow vs Estonian Single Mother Households
COMPARE
Crow
Estonian
Single Mother Households
Single Mother Households Comparison
Crow
Estonians
7.4%
SINGLE MOTHER HOUSEHOLDS
0.1/ 100
METRIC RATING
265th/ 347
METRIC RANK
5.4%
SINGLE MOTHER HOUSEHOLDS
99.6/ 100
METRIC RATING
40th/ 347
METRIC RANK
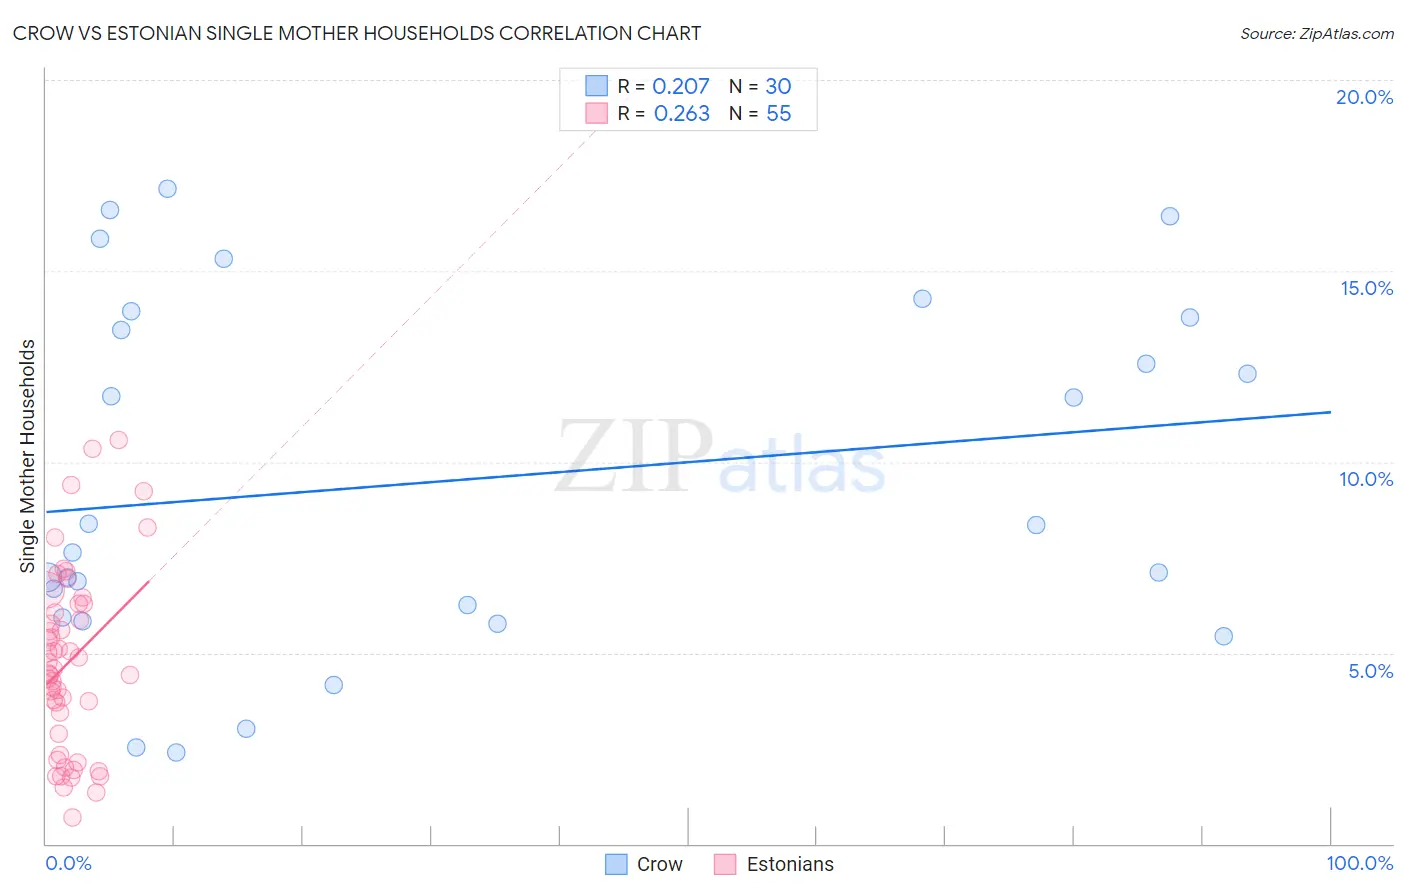
Crow vs Estonian Single Mother Households Correlation Chart
The statistical analysis conducted on geographies consisting of 59,176,023 people shows a weak positive correlation between the proportion of Crow and percentage of single mother households in the United States with a correlation coefficient (R) of 0.207 and weighted average of 7.4%. Similarly, the statistical analysis conducted on geographies consisting of 123,346,647 people shows a weak positive correlation between the proportion of Estonians and percentage of single mother households in the United States with a correlation coefficient (R) of 0.263 and weighted average of 5.4%, a difference of 38.8%.
Single Mother Households Correlation Summary
| Measurement | Crow | Estonian |
| Minimum | 2.4% | 0.68% |
| Maximum | 17.1% | 10.6% |
| Range | 14.8% | 9.9% |
| Mean | 9.5% | 4.8% |
| Median | 8.0% | 4.6% |
| Interquartile 25% (IQ1) | 5.9% | 2.9% |
| Interquartile 75% (IQ3) | 13.8% | 6.3% |
| Interquartile Range (IQR) | 7.8% | 3.4% |
| Standard Deviation (Sample) | 4.6% | 2.4% |
| Standard Deviation (Population) | 4.5% | 2.3% |
Similar Demographics by Single Mother Households
Demographics Similar to Crow by Single Mother Households
In terms of single mother households, the demographic groups most similar to Crow are Nepalese (7.5%, a difference of 0.090%), Yaqui (7.4%, a difference of 0.18%), Immigrants from Nicaragua (7.4%, a difference of 0.25%), Immigrants from Somalia (7.4%, a difference of 0.40%), and Blackfeet (7.5%, a difference of 0.43%).
| Demographics | Rating | Rank | Single Mother Households |
| Pueblo | 0.2 /100 | #258 | Tragic 7.4% |
| Immigrants | Yemen | 0.2 /100 | #259 | Tragic 7.4% |
| Immigrants | Zaire | 0.2 /100 | #260 | Tragic 7.4% |
| Japanese | 0.2 /100 | #261 | Tragic 7.4% |
| Immigrants | Somalia | 0.2 /100 | #262 | Tragic 7.4% |
| Immigrants | Nicaragua | 0.2 /100 | #263 | Tragic 7.4% |
| Yaqui | 0.1 /100 | #264 | Tragic 7.4% |
| Crow | 0.1 /100 | #265 | Tragic 7.4% |
| Nepalese | 0.1 /100 | #266 | Tragic 7.5% |
| Blackfeet | 0.1 /100 | #267 | Tragic 7.5% |
| Indonesians | 0.1 /100 | #268 | Tragic 7.5% |
| Somalis | 0.1 /100 | #269 | Tragic 7.5% |
| Immigrants | Cuba | 0.1 /100 | #270 | Tragic 7.5% |
| Salvadorans | 0.1 /100 | #271 | Tragic 7.5% |
| Immigrants | Azores | 0.1 /100 | #272 | Tragic 7.5% |
Demographics Similar to Estonians by Single Mother Households
In terms of single mother households, the demographic groups most similar to Estonians are Immigrants from Sweden (5.4%, a difference of 0.11%), Immigrants from Serbia (5.4%, a difference of 0.25%), Immigrants from Greece (5.4%, a difference of 0.42%), Macedonian (5.4%, a difference of 0.50%), and Immigrants from South Central Asia (5.4%, a difference of 0.56%).
| Demographics | Rating | Rank | Single Mother Households |
| Immigrants | Switzerland | 99.7 /100 | #33 | Exceptional 5.3% |
| Bulgarians | 99.7 /100 | #34 | Exceptional 5.3% |
| Immigrants | Northern Europe | 99.7 /100 | #35 | Exceptional 5.3% |
| Immigrants | Czechoslovakia | 99.7 /100 | #36 | Exceptional 5.3% |
| Immigrants | Belgium | 99.7 /100 | #37 | Exceptional 5.3% |
| Immigrants | Serbia | 99.6 /100 | #38 | Exceptional 5.4% |
| Immigrants | Sweden | 99.6 /100 | #39 | Exceptional 5.4% |
| Estonians | 99.6 /100 | #40 | Exceptional 5.4% |
| Immigrants | Greece | 99.5 /100 | #41 | Exceptional 5.4% |
| Macedonians | 99.5 /100 | #42 | Exceptional 5.4% |
| Immigrants | South Central Asia | 99.5 /100 | #43 | Exceptional 5.4% |
| Lithuanians | 99.4 /100 | #44 | Exceptional 5.4% |
| Immigrants | Croatia | 99.4 /100 | #45 | Exceptional 5.4% |
| Croatians | 99.3 /100 | #46 | Exceptional 5.5% |
| Norwegians | 99.3 /100 | #47 | Exceptional 5.5% |