Norwegian vs Estonian Master's Degree
COMPARE
Norwegian
Estonian
Master's Degree
Master's Degree Comparison
Norwegians
Estonians
14.0%
MASTER'S DEGREE
13.6/ 100
METRIC RATING
219th/ 347
METRIC RANK
18.8%
MASTER'S DEGREE
100.0/ 100
METRIC RATING
49th/ 347
METRIC RANK
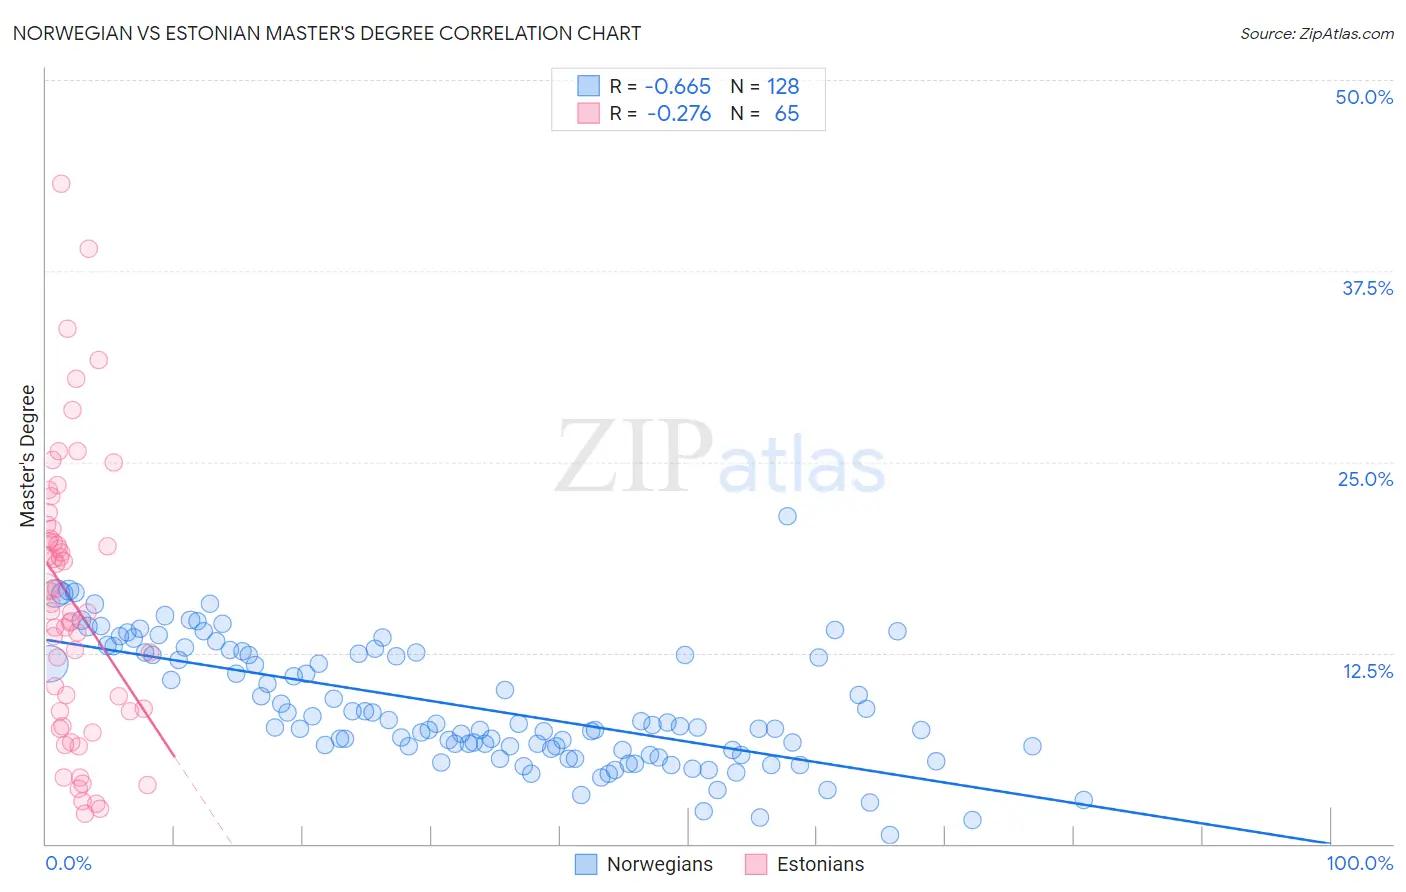
Norwegian vs Estonian Master's Degree Correlation Chart
The statistical analysis conducted on geographies consisting of 532,895,610 people shows a significant negative correlation between the proportion of Norwegians and percentage of population with at least master's degree education in the United States with a correlation coefficient (R) of -0.665 and weighted average of 14.0%. Similarly, the statistical analysis conducted on geographies consisting of 123,509,943 people shows a weak negative correlation between the proportion of Estonians and percentage of population with at least master's degree education in the United States with a correlation coefficient (R) of -0.276 and weighted average of 18.8%, a difference of 33.8%.
Master's Degree Correlation Summary
| Measurement | Norwegian | Estonian |
| Minimum | 0.57% | 2.0% |
| Maximum | 21.5% | 43.2% |
| Range | 20.9% | 41.2% |
| Mean | 9.0% | 15.9% |
| Median | 7.8% | 15.2% |
| Interquartile 25% (IQ1) | 6.2% | 8.7% |
| Interquartile 75% (IQ3) | 12.5% | 20.3% |
| Interquartile Range (IQR) | 6.3% | 11.6% |
| Standard Deviation (Sample) | 4.0% | 9.0% |
| Standard Deviation (Population) | 4.0% | 8.9% |
Similar Demographics by Master's Degree
Demographics Similar to Norwegians by Master's Degree
In terms of master's degree, the demographic groups most similar to Norwegians are German (14.0%, a difference of 0.15%), Korean (14.0%, a difference of 0.29%), Ecuadorian (14.0%, a difference of 0.32%), French Canadian (14.1%, a difference of 0.35%), and Immigrants from South Eastern Asia (14.0%, a difference of 0.52%).
| Demographics | Rating | Rank | Master's Degree |
| Spanish | 17.8 /100 | #212 | Poor 14.2% |
| Immigrants | Thailand | 17.0 /100 | #213 | Poor 14.2% |
| Finns | 16.9 /100 | #214 | Poor 14.2% |
| Immigrants | Vietnam | 16.1 /100 | #215 | Poor 14.1% |
| Immigrants | Somalia | 15.8 /100 | #216 | Poor 14.1% |
| Immigrants | Trinidad and Tobago | 15.8 /100 | #217 | Poor 14.1% |
| French Canadians | 14.9 /100 | #218 | Poor 14.1% |
| Norwegians | 13.6 /100 | #219 | Poor 14.0% |
| Germans | 13.1 /100 | #220 | Poor 14.0% |
| Koreans | 12.7 /100 | #221 | Poor 14.0% |
| Ecuadorians | 12.6 /100 | #222 | Poor 14.0% |
| Immigrants | South Eastern Asia | 11.9 /100 | #223 | Poor 14.0% |
| Immigrants | Grenada | 11.8 /100 | #224 | Poor 14.0% |
| Portuguese | 11.2 /100 | #225 | Poor 13.9% |
| Immigrants | St. Vincent and the Grenadines | 11.0 /100 | #226 | Poor 13.9% |
Demographics Similar to Estonians by Master's Degree
In terms of master's degree, the demographic groups most similar to Estonians are Paraguayan (18.8%, a difference of 0.10%), Immigrants from Austria (18.8%, a difference of 0.16%), Immigrants from Norway (18.8%, a difference of 0.17%), Bulgarian (18.8%, a difference of 0.19%), and Immigrants from South Africa (18.8%, a difference of 0.20%).
| Demographics | Rating | Rank | Master's Degree |
| Immigrants | Saudi Arabia | 100.0 /100 | #42 | Exceptional 19.0% |
| Immigrants | Greece | 100.0 /100 | #43 | Exceptional 19.0% |
| Immigrants | Malaysia | 100.0 /100 | #44 | Exceptional 18.9% |
| Immigrants | Belarus | 100.0 /100 | #45 | Exceptional 18.9% |
| Immigrants | Norway | 100.0 /100 | #46 | Exceptional 18.8% |
| Immigrants | Austria | 100.0 /100 | #47 | Exceptional 18.8% |
| Paraguayans | 100.0 /100 | #48 | Exceptional 18.8% |
| Estonians | 100.0 /100 | #49 | Exceptional 18.8% |
| Bulgarians | 100.0 /100 | #50 | Exceptional 18.8% |
| Immigrants | South Africa | 100.0 /100 | #51 | Exceptional 18.8% |
| Immigrants | Kuwait | 100.0 /100 | #52 | Exceptional 18.6% |
| Immigrants | Czechoslovakia | 99.9 /100 | #53 | Exceptional 18.5% |
| Immigrants | Lithuania | 99.9 /100 | #54 | Exceptional 18.5% |
| Immigrants | Serbia | 99.9 /100 | #55 | Exceptional 18.5% |
| Asians | 99.9 /100 | #56 | Exceptional 18.4% |