Kenyan vs Estonian Master's Degree
COMPARE
Kenyan
Estonian
Master's Degree
Master's Degree Comparison
Kenyans
Estonians
15.3%
MASTER'S DEGREE
70.3/ 100
METRIC RATING
160th/ 347
METRIC RANK
18.8%
MASTER'S DEGREE
100.0/ 100
METRIC RATING
49th/ 347
METRIC RANK
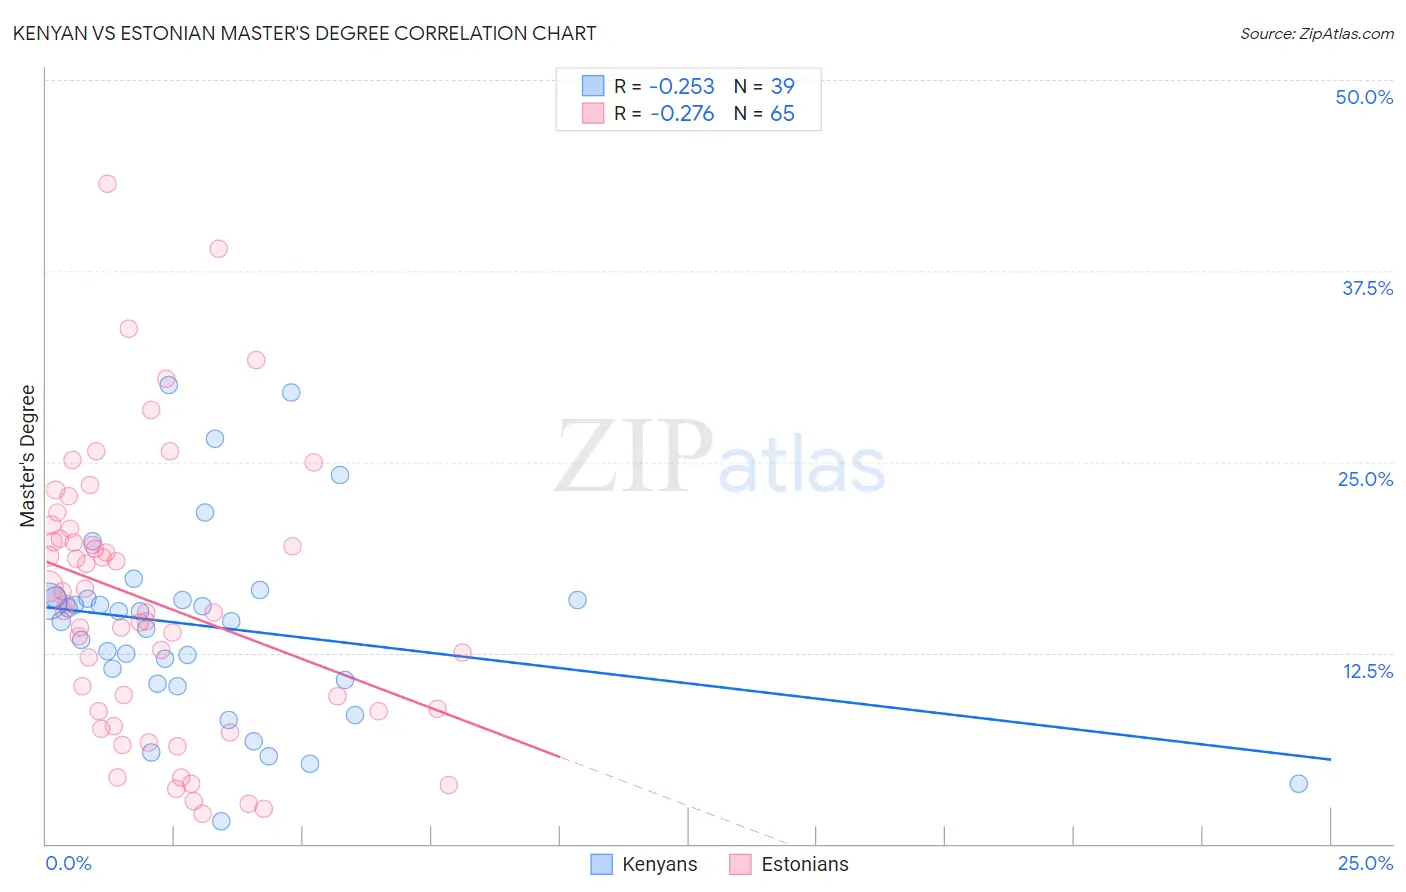
Kenyan vs Estonian Master's Degree Correlation Chart
The statistical analysis conducted on geographies consisting of 168,212,419 people shows a weak negative correlation between the proportion of Kenyans and percentage of population with at least master's degree education in the United States with a correlation coefficient (R) of -0.253 and weighted average of 15.3%. Similarly, the statistical analysis conducted on geographies consisting of 123,509,943 people shows a weak negative correlation between the proportion of Estonians and percentage of population with at least master's degree education in the United States with a correlation coefficient (R) of -0.276 and weighted average of 18.8%, a difference of 22.6%.
Master's Degree Correlation Summary
| Measurement | Kenyan | Estonian |
| Minimum | 1.5% | 2.0% |
| Maximum | 30.0% | 43.2% |
| Range | 28.5% | 41.2% |
| Mean | 14.2% | 15.9% |
| Median | 14.6% | 15.2% |
| Interquartile 25% (IQ1) | 10.5% | 8.7% |
| Interquartile 75% (IQ3) | 16.0% | 20.3% |
| Interquartile Range (IQR) | 5.6% | 11.6% |
| Standard Deviation (Sample) | 6.4% | 9.0% |
| Standard Deviation (Population) | 6.3% | 8.9% |
Similar Demographics by Master's Degree
Demographics Similar to Kenyans by Master's Degree
In terms of master's degree, the demographic groups most similar to Kenyans are Luxembourger (15.3%, a difference of 0.11%), Immigrants from Poland (15.4%, a difference of 0.18%), Immigrants from Cameroon (15.4%, a difference of 0.22%), Sudanese (15.3%, a difference of 0.23%), and Peruvian (15.3%, a difference of 0.24%).
| Demographics | Rating | Rank | Master's Degree |
| Icelanders | 76.8 /100 | #153 | Good 15.5% |
| Immigrants | South America | 76.3 /100 | #154 | Good 15.5% |
| Immigrants | Bangladesh | 76.1 /100 | #155 | Good 15.5% |
| Bermudans | 73.9 /100 | #156 | Good 15.4% |
| Immigrants | Cameroon | 71.7 /100 | #157 | Good 15.4% |
| Immigrants | Poland | 71.5 /100 | #158 | Good 15.4% |
| Luxembourgers | 71.0 /100 | #159 | Good 15.3% |
| Kenyans | 70.3 /100 | #160 | Good 15.3% |
| Sudanese | 68.7 /100 | #161 | Good 15.3% |
| Peruvians | 68.7 /100 | #162 | Good 15.3% |
| Uruguayans | 67.1 /100 | #163 | Good 15.3% |
| Colombians | 66.9 /100 | #164 | Good 15.3% |
| Immigrants | Kenya | 66.6 /100 | #165 | Good 15.3% |
| Swedes | 66.1 /100 | #166 | Good 15.2% |
| Senegalese | 65.6 /100 | #167 | Good 15.2% |
Demographics Similar to Estonians by Master's Degree
In terms of master's degree, the demographic groups most similar to Estonians are Paraguayan (18.8%, a difference of 0.10%), Immigrants from Austria (18.8%, a difference of 0.16%), Immigrants from Norway (18.8%, a difference of 0.17%), Bulgarian (18.8%, a difference of 0.19%), and Immigrants from South Africa (18.8%, a difference of 0.20%).
| Demographics | Rating | Rank | Master's Degree |
| Immigrants | Saudi Arabia | 100.0 /100 | #42 | Exceptional 19.0% |
| Immigrants | Greece | 100.0 /100 | #43 | Exceptional 19.0% |
| Immigrants | Malaysia | 100.0 /100 | #44 | Exceptional 18.9% |
| Immigrants | Belarus | 100.0 /100 | #45 | Exceptional 18.9% |
| Immigrants | Norway | 100.0 /100 | #46 | Exceptional 18.8% |
| Immigrants | Austria | 100.0 /100 | #47 | Exceptional 18.8% |
| Paraguayans | 100.0 /100 | #48 | Exceptional 18.8% |
| Estonians | 100.0 /100 | #49 | Exceptional 18.8% |
| Bulgarians | 100.0 /100 | #50 | Exceptional 18.8% |
| Immigrants | South Africa | 100.0 /100 | #51 | Exceptional 18.8% |
| Immigrants | Kuwait | 100.0 /100 | #52 | Exceptional 18.6% |
| Immigrants | Czechoslovakia | 99.9 /100 | #53 | Exceptional 18.5% |
| Immigrants | Lithuania | 99.9 /100 | #54 | Exceptional 18.5% |
| Immigrants | Serbia | 99.9 /100 | #55 | Exceptional 18.5% |
| Asians | 99.9 /100 | #56 | Exceptional 18.4% |