Costa Rican vs Immigrants from Denmark Poverty
COMPARE
Costa Rican
Immigrants from Denmark
Poverty
Poverty Comparison
Costa Ricans
Immigrants from Denmark
12.2%
POVERTY
62.2/ 100
METRIC RATING
157th/ 347
METRIC RANK
11.4%
POVERTY
95.5/ 100
METRIC RATING
90th/ 347
METRIC RANK
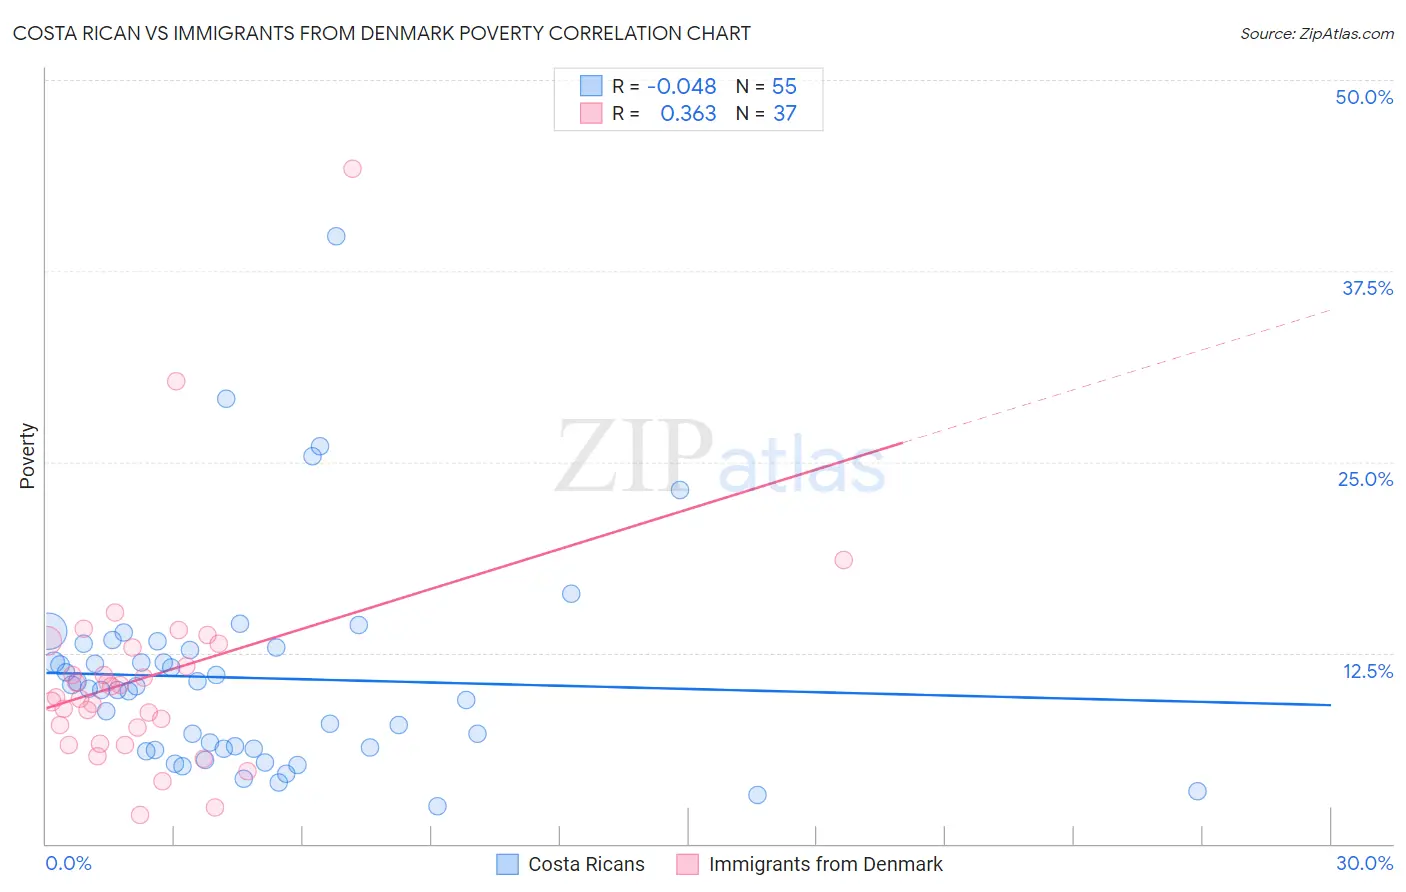
Costa Rican vs Immigrants from Denmark Poverty Correlation Chart
The statistical analysis conducted on geographies consisting of 253,487,550 people shows no correlation between the proportion of Costa Ricans and poverty level in the United States with a correlation coefficient (R) of -0.048 and weighted average of 12.2%. Similarly, the statistical analysis conducted on geographies consisting of 136,404,120 people shows a mild positive correlation between the proportion of Immigrants from Denmark and poverty level in the United States with a correlation coefficient (R) of 0.363 and weighted average of 11.4%, a difference of 6.7%.
Poverty Correlation Summary
| Measurement | Costa Rican | Immigrants from Denmark |
| Minimum | 2.4% | 1.9% |
| Maximum | 39.8% | 44.2% |
| Range | 37.4% | 42.3% |
| Mean | 10.8% | 11.0% |
| Median | 10.2% | 9.6% |
| Interquartile 25% (IQ1) | 6.2% | 7.1% |
| Interquartile 75% (IQ3) | 12.8% | 13.0% |
| Interquartile Range (IQR) | 6.6% | 5.9% |
| Standard Deviation (Sample) | 6.9% | 7.5% |
| Standard Deviation (Population) | 6.8% | 7.4% |
Similar Demographics by Poverty
Demographics Similar to Costa Ricans by Poverty
In terms of poverty, the demographic groups most similar to Costa Ricans are Scotch-Irish (12.2%, a difference of 0.040%), Taiwanese (12.2%, a difference of 0.040%), Pennsylvania German (12.2%, a difference of 0.14%), Hungarian (12.2%, a difference of 0.15%), and Immigrants from Northern Africa (12.1%, a difference of 0.18%).
| Demographics | Rating | Rank | Poverty |
| Immigrants | Kazakhstan | 72.3 /100 | #150 | Good 12.0% |
| Samoans | 71.9 /100 | #151 | Good 12.0% |
| Armenians | 67.6 /100 | #152 | Good 12.1% |
| Immigrants | Northern Africa | 63.9 /100 | #153 | Good 12.1% |
| Guamanians/Chamorros | 63.9 /100 | #154 | Good 12.1% |
| Hungarians | 63.6 /100 | #155 | Good 12.2% |
| Scotch-Irish | 62.6 /100 | #156 | Good 12.2% |
| Costa Ricans | 62.2 /100 | #157 | Good 12.2% |
| Taiwanese | 61.8 /100 | #158 | Good 12.2% |
| Pennsylvania Germans | 60.8 /100 | #159 | Good 12.2% |
| Immigrants | Nepal | 60.4 /100 | #160 | Good 12.2% |
| Immigrants | Fiji | 59.1 /100 | #161 | Average 12.2% |
| Ethiopians | 59.1 /100 | #162 | Average 12.2% |
| Immigrants | Ethiopia | 58.6 /100 | #163 | Average 12.2% |
| Colombians | 57.8 /100 | #164 | Average 12.2% |
Demographics Similar to Immigrants from Denmark by Poverty
In terms of poverty, the demographic groups most similar to Immigrants from Denmark are Finnish (11.4%, a difference of 0.13%), Czechoslovakian (11.4%, a difference of 0.17%), Belgian (11.4%, a difference of 0.20%), British (11.4%, a difference of 0.27%), and Romanian (11.4%, a difference of 0.31%).
| Demographics | Rating | Rank | Poverty |
| Immigrants | Sweden | 96.3 /100 | #83 | Exceptional 11.3% |
| English | 96.3 /100 | #84 | Exceptional 11.3% |
| Immigrants | England | 96.2 /100 | #85 | Exceptional 11.4% |
| Jordanians | 96.0 /100 | #86 | Exceptional 11.4% |
| Northern Europeans | 96.0 /100 | #87 | Exceptional 11.4% |
| Belgians | 95.8 /100 | #88 | Exceptional 11.4% |
| Czechoslovakians | 95.7 /100 | #89 | Exceptional 11.4% |
| Immigrants | Denmark | 95.5 /100 | #90 | Exceptional 11.4% |
| Finns | 95.2 /100 | #91 | Exceptional 11.4% |
| British | 95.0 /100 | #92 | Exceptional 11.4% |
| Romanians | 94.9 /100 | #93 | Exceptional 11.4% |
| Paraguayans | 94.9 /100 | #94 | Exceptional 11.4% |
| Australians | 94.9 /100 | #95 | Exceptional 11.4% |
| Immigrants | South Africa | 94.7 /100 | #96 | Exceptional 11.5% |
| Immigrants | Egypt | 94.6 /100 | #97 | Exceptional 11.5% |