Haitian vs Immigrants from Denmark College, 1 year or more
COMPARE
Haitian
Immigrants from Denmark
College, 1 year or more
College, 1 year or more Comparison
Haitians
Immigrants from Denmark
52.3%
COLLEGE, 1 YEAR OR MORE
0.0/ 100
METRIC RATING
301st/ 347
METRIC RANK
65.6%
COLLEGE, 1 YEAR OR MORE
100.0/ 100
METRIC RATING
30th/ 347
METRIC RANK
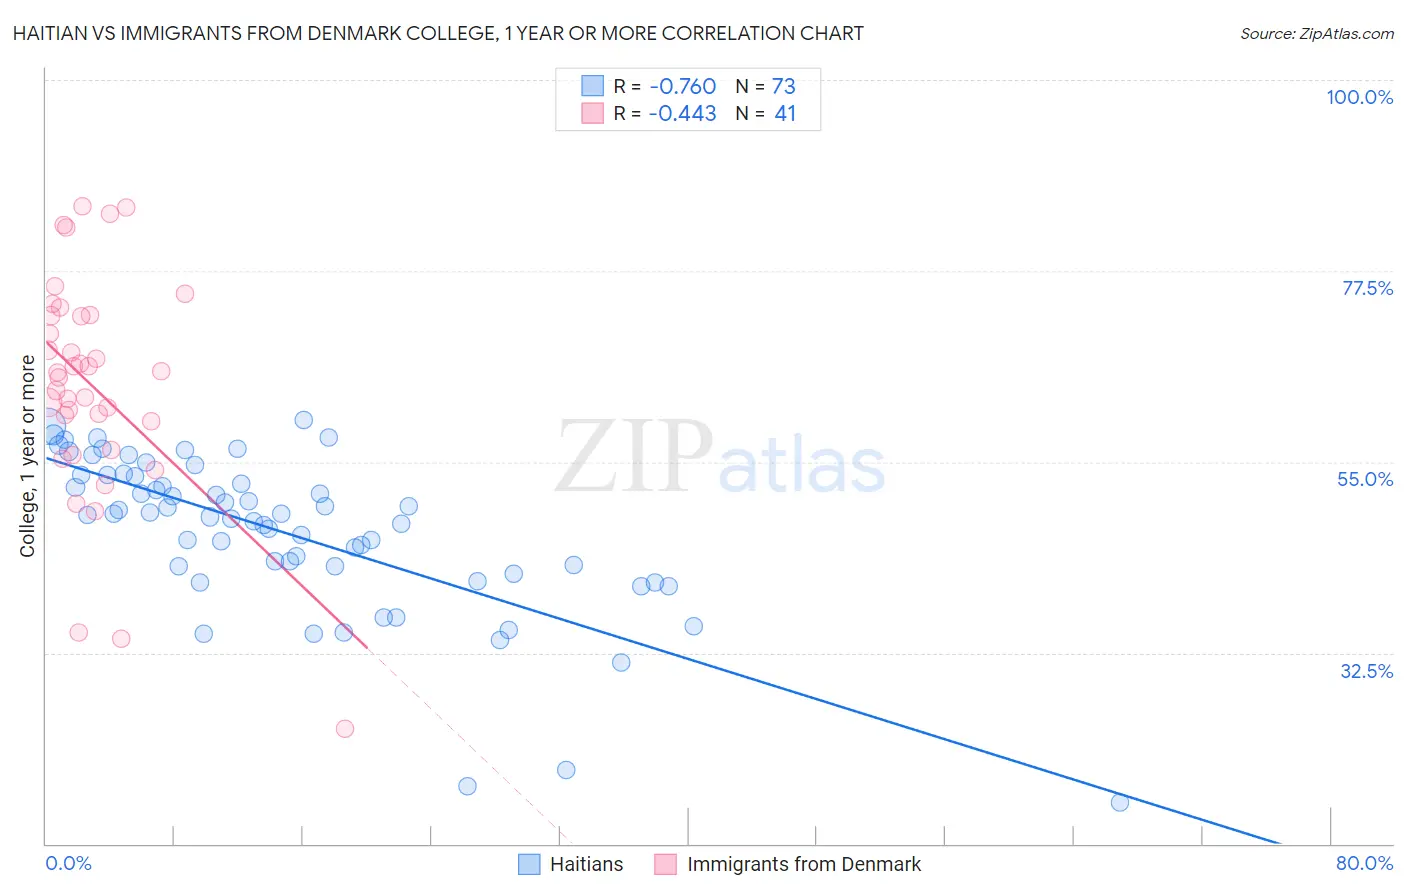
Haitian vs Immigrants from Denmark College, 1 year or more Correlation Chart
The statistical analysis conducted on geographies consisting of 288,015,465 people shows a strong negative correlation between the proportion of Haitians and percentage of population with at least college, 1 year or more education in the United States with a correlation coefficient (R) of -0.760 and weighted average of 52.3%. Similarly, the statistical analysis conducted on geographies consisting of 136,430,932 people shows a moderate negative correlation between the proportion of Immigrants from Denmark and percentage of population with at least college, 1 year or more education in the United States with a correlation coefficient (R) of -0.443 and weighted average of 65.6%, a difference of 25.4%.
College, 1 year or more Correlation Summary
| Measurement | Haitian | Immigrants from Denmark |
| Minimum | 14.8% | 23.5% |
| Maximum | 59.9% | 85.2% |
| Range | 45.1% | 61.6% |
| Mean | 46.6% | 64.0% |
| Median | 48.7% | 65.5% |
| Interquartile 25% (IQ1) | 42.3% | 58.1% |
| Interquartile 75% (IQ3) | 53.4% | 72.3% |
| Interquartile Range (IQR) | 11.1% | 14.1% |
| Standard Deviation (Sample) | 9.4% | 13.3% |
| Standard Deviation (Population) | 9.3% | 13.1% |
Similar Demographics by College, 1 year or more
Demographics Similar to Haitians by College, 1 year or more
In terms of college, 1 year or more, the demographic groups most similar to Haitians are Choctaw (52.3%, a difference of 0.060%), Immigrants from Nicaragua (52.4%, a difference of 0.10%), Puerto Rican (52.2%, a difference of 0.13%), Creek (52.2%, a difference of 0.21%), and Central American (52.1%, a difference of 0.34%).
| Demographics | Rating | Rank | College, 1 year or more |
| Cherokee | 0.0 /100 | #294 | Tragic 53.2% |
| Yaqui | 0.0 /100 | #295 | Tragic 53.2% |
| Sioux | 0.0 /100 | #296 | Tragic 53.0% |
| Paiute | 0.0 /100 | #297 | Tragic 52.9% |
| Immigrants | Dominica | 0.0 /100 | #298 | Tragic 52.5% |
| Immigrants | Nicaragua | 0.0 /100 | #299 | Tragic 52.4% |
| Choctaw | 0.0 /100 | #300 | Tragic 52.3% |
| Haitians | 0.0 /100 | #301 | Tragic 52.3% |
| Puerto Ricans | 0.0 /100 | #302 | Tragic 52.2% |
| Creek | 0.0 /100 | #303 | Tragic 52.2% |
| Central Americans | 0.0 /100 | #304 | Tragic 52.1% |
| Seminole | 0.0 /100 | #305 | Tragic 52.1% |
| Mexican American Indians | 0.0 /100 | #306 | Tragic 51.9% |
| Immigrants | Portugal | 0.0 /100 | #307 | Tragic 51.9% |
| Salvadorans | 0.0 /100 | #308 | Tragic 51.8% |
Demographics Similar to Immigrants from Denmark by College, 1 year or more
In terms of college, 1 year or more, the demographic groups most similar to Immigrants from Denmark are Turkish (65.5%, a difference of 0.080%), Immigrants from Northern Europe (65.6%, a difference of 0.11%), Bulgarian (65.5%, a difference of 0.13%), Immigrants from Sri Lanka (65.4%, a difference of 0.28%), and Immigrants from France (65.8%, a difference of 0.36%).
| Demographics | Rating | Rank | College, 1 year or more |
| Immigrants | China | 100.0 /100 | #23 | Exceptional 66.4% |
| Immigrants | Belgium | 100.0 /100 | #24 | Exceptional 66.3% |
| Indians (Asian) | 100.0 /100 | #25 | Exceptional 66.1% |
| Latvians | 100.0 /100 | #26 | Exceptional 66.1% |
| Immigrants | Ireland | 100.0 /100 | #27 | Exceptional 65.9% |
| Immigrants | France | 100.0 /100 | #28 | Exceptional 65.8% |
| Immigrants | Northern Europe | 100.0 /100 | #29 | Exceptional 65.6% |
| Immigrants | Denmark | 100.0 /100 | #30 | Exceptional 65.6% |
| Turks | 100.0 /100 | #31 | Exceptional 65.5% |
| Bulgarians | 100.0 /100 | #32 | Exceptional 65.5% |
| Immigrants | Sri Lanka | 99.9 /100 | #33 | Exceptional 65.4% |
| Israelis | 99.9 /100 | #34 | Exceptional 65.3% |
| Immigrants | Turkey | 99.9 /100 | #35 | Exceptional 65.2% |
| Immigrants | South Africa | 99.9 /100 | #36 | Exceptional 65.1% |
| Russians | 99.9 /100 | #37 | Exceptional 65.1% |