Ute vs Immigrants from Denmark College, 1 year or more
COMPARE
Ute
Immigrants from Denmark
College, 1 year or more
College, 1 year or more Comparison
Ute
Immigrants from Denmark
53.8%
COLLEGE, 1 YEAR OR MORE
0.1/ 100
METRIC RATING
284th/ 347
METRIC RANK
65.6%
COLLEGE, 1 YEAR OR MORE
100.0/ 100
METRIC RATING
30th/ 347
METRIC RANK
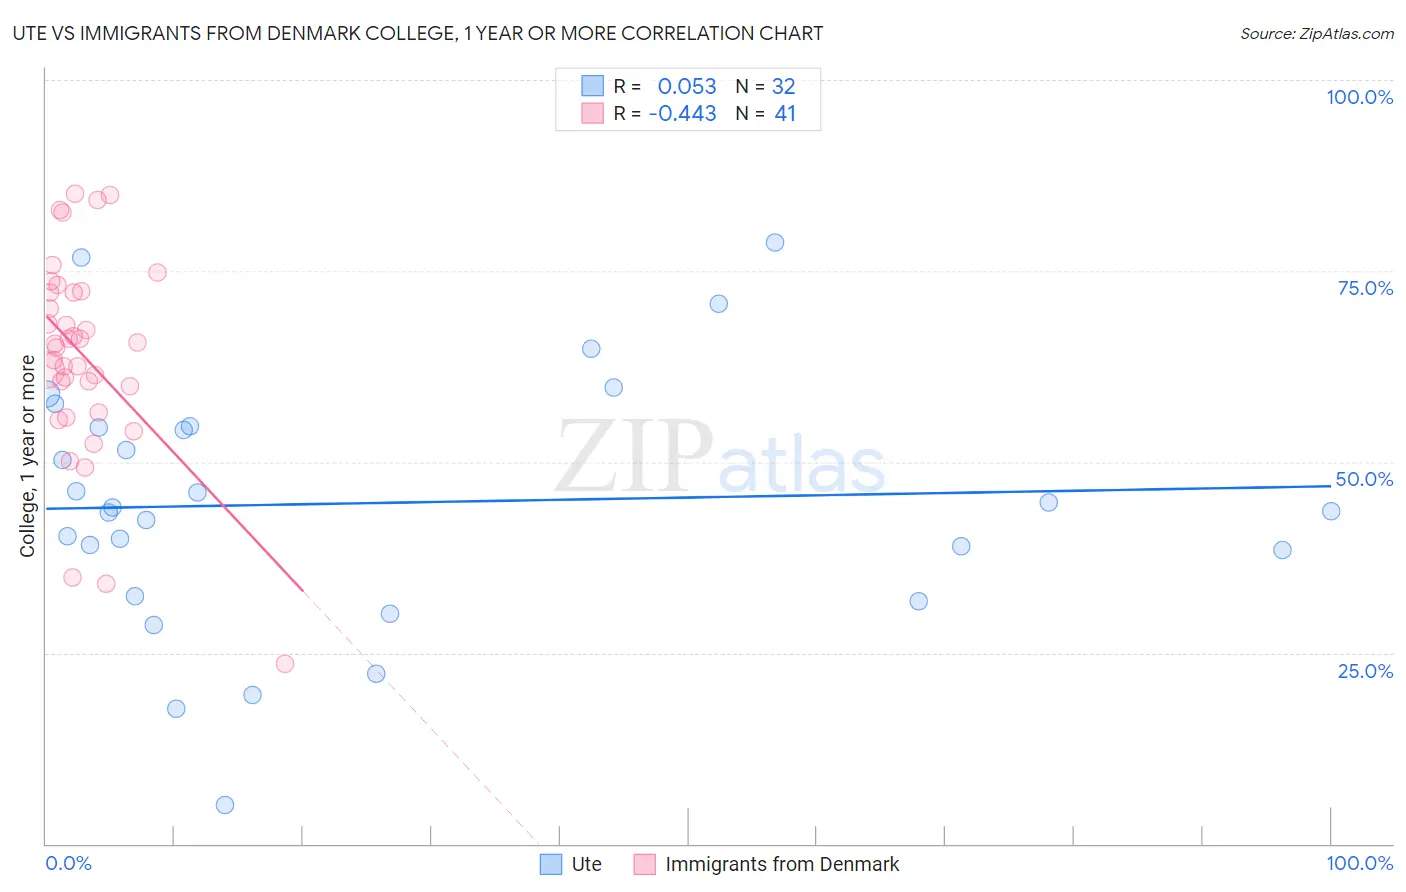
Ute vs Immigrants from Denmark College, 1 year or more Correlation Chart
The statistical analysis conducted on geographies consisting of 55,668,599 people shows a slight positive correlation between the proportion of Ute and percentage of population with at least college, 1 year or more education in the United States with a correlation coefficient (R) of 0.053 and weighted average of 53.8%. Similarly, the statistical analysis conducted on geographies consisting of 136,430,932 people shows a moderate negative correlation between the proportion of Immigrants from Denmark and percentage of population with at least college, 1 year or more education in the United States with a correlation coefficient (R) of -0.443 and weighted average of 65.6%, a difference of 21.9%.
College, 1 year or more Correlation Summary
| Measurement | Ute | Immigrants from Denmark |
| Minimum | 5.1% | 23.5% |
| Maximum | 78.7% | 85.2% |
| Range | 73.6% | 61.6% |
| Mean | 44.6% | 64.0% |
| Median | 43.8% | 65.5% |
| Interquartile 25% (IQ1) | 35.4% | 58.1% |
| Interquartile 75% (IQ3) | 54.6% | 72.3% |
| Interquartile Range (IQR) | 19.2% | 14.1% |
| Standard Deviation (Sample) | 16.7% | 13.3% |
| Standard Deviation (Population) | 16.4% | 13.1% |
Similar Demographics by College, 1 year or more
Demographics Similar to Ute by College, 1 year or more
In terms of college, 1 year or more, the demographic groups most similar to Ute are Nicaraguan (53.9%, a difference of 0.17%), Immigrants from Guyana (53.5%, a difference of 0.46%), Central American Indian (53.5%, a difference of 0.51%), Guyanese (54.1%, a difference of 0.53%), and Immigrants from Belize (53.5%, a difference of 0.54%).
| Demographics | Rating | Rank | College, 1 year or more |
| Ecuadorians | 0.2 /100 | #277 | Tragic 54.3% |
| Immigrants | Jamaica | 0.1 /100 | #278 | Tragic 54.2% |
| Arapaho | 0.1 /100 | #279 | Tragic 54.1% |
| Cheyenne | 0.1 /100 | #280 | Tragic 54.1% |
| Colville | 0.1 /100 | #281 | Tragic 54.1% |
| Guyanese | 0.1 /100 | #282 | Tragic 54.1% |
| Nicaraguans | 0.1 /100 | #283 | Tragic 53.9% |
| Ute | 0.1 /100 | #284 | Tragic 53.8% |
| Immigrants | Guyana | 0.1 /100 | #285 | Tragic 53.5% |
| Central American Indians | 0.1 /100 | #286 | Tragic 53.5% |
| Immigrants | Belize | 0.1 /100 | #287 | Tragic 53.5% |
| Alaska Natives | 0.0 /100 | #288 | Tragic 53.4% |
| Immigrants | Ecuador | 0.0 /100 | #289 | Tragic 53.4% |
| Alaskan Athabascans | 0.0 /100 | #290 | Tragic 53.4% |
| Cubans | 0.0 /100 | #291 | Tragic 53.4% |
Demographics Similar to Immigrants from Denmark by College, 1 year or more
In terms of college, 1 year or more, the demographic groups most similar to Immigrants from Denmark are Turkish (65.5%, a difference of 0.080%), Immigrants from Northern Europe (65.6%, a difference of 0.11%), Bulgarian (65.5%, a difference of 0.13%), Immigrants from Sri Lanka (65.4%, a difference of 0.28%), and Immigrants from France (65.8%, a difference of 0.36%).
| Demographics | Rating | Rank | College, 1 year or more |
| Immigrants | China | 100.0 /100 | #23 | Exceptional 66.4% |
| Immigrants | Belgium | 100.0 /100 | #24 | Exceptional 66.3% |
| Indians (Asian) | 100.0 /100 | #25 | Exceptional 66.1% |
| Latvians | 100.0 /100 | #26 | Exceptional 66.1% |
| Immigrants | Ireland | 100.0 /100 | #27 | Exceptional 65.9% |
| Immigrants | France | 100.0 /100 | #28 | Exceptional 65.8% |
| Immigrants | Northern Europe | 100.0 /100 | #29 | Exceptional 65.6% |
| Immigrants | Denmark | 100.0 /100 | #30 | Exceptional 65.6% |
| Turks | 100.0 /100 | #31 | Exceptional 65.5% |
| Bulgarians | 100.0 /100 | #32 | Exceptional 65.5% |
| Immigrants | Sri Lanka | 99.9 /100 | #33 | Exceptional 65.4% |
| Israelis | 99.9 /100 | #34 | Exceptional 65.3% |
| Immigrants | Turkey | 99.9 /100 | #35 | Exceptional 65.2% |
| Immigrants | South Africa | 99.9 /100 | #36 | Exceptional 65.1% |
| Russians | 99.9 /100 | #37 | Exceptional 65.1% |