Estonian vs Immigrants from Denmark College, 1 year or more
COMPARE
Estonian
Immigrants from Denmark
College, 1 year or more
College, 1 year or more Comparison
Estonians
Immigrants from Denmark
65.0%
COLLEGE, 1 YEAR OR MORE
99.9/ 100
METRIC RATING
39th/ 347
METRIC RANK
65.6%
COLLEGE, 1 YEAR OR MORE
100.0/ 100
METRIC RATING
30th/ 347
METRIC RANK
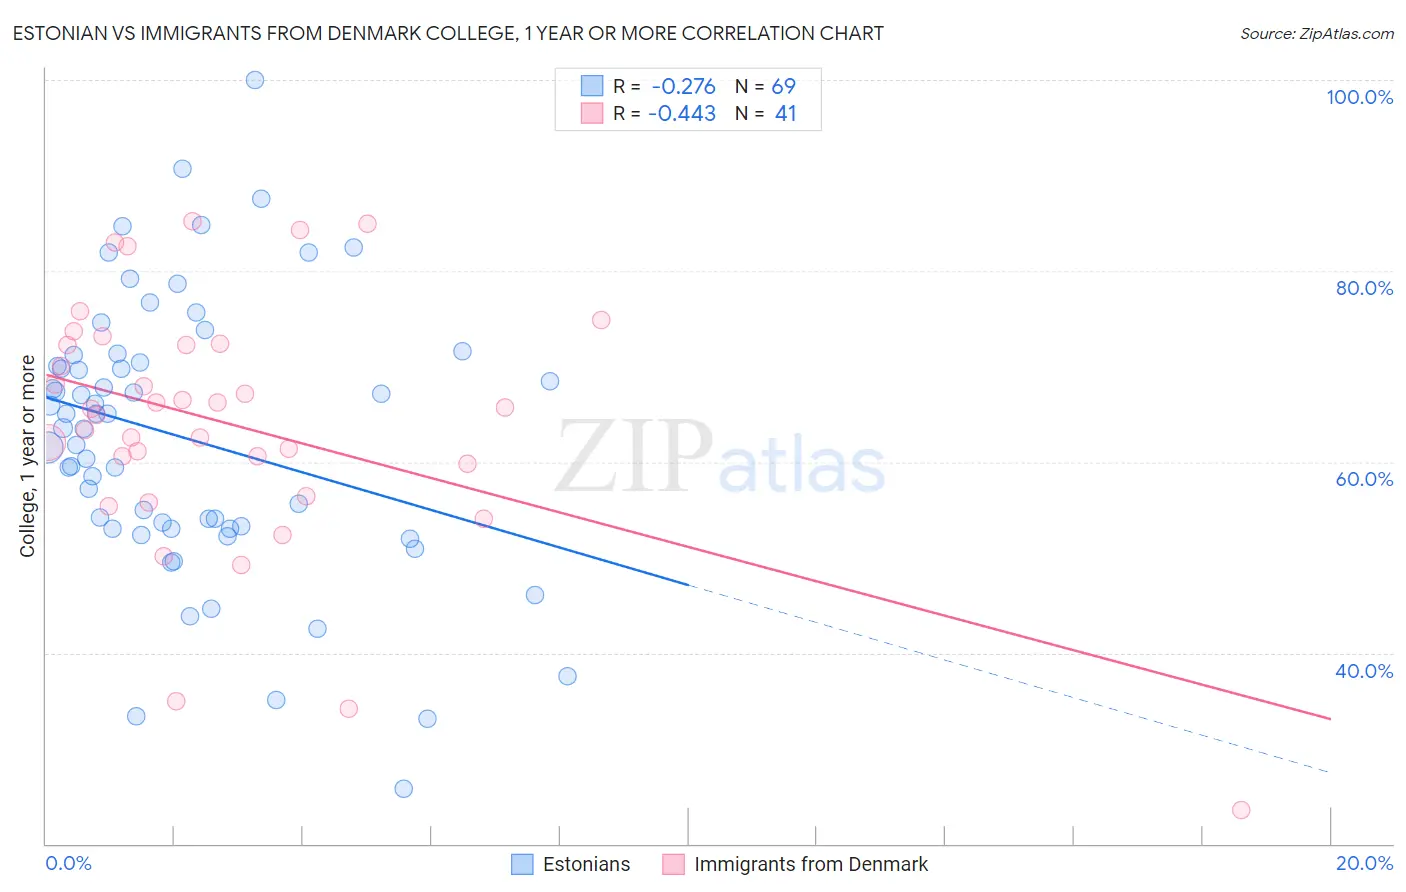
Estonian vs Immigrants from Denmark College, 1 year or more Correlation Chart
The statistical analysis conducted on geographies consisting of 123,528,478 people shows a weak negative correlation between the proportion of Estonians and percentage of population with at least college, 1 year or more education in the United States with a correlation coefficient (R) of -0.276 and weighted average of 65.0%. Similarly, the statistical analysis conducted on geographies consisting of 136,430,932 people shows a moderate negative correlation between the proportion of Immigrants from Denmark and percentage of population with at least college, 1 year or more education in the United States with a correlation coefficient (R) of -0.443 and weighted average of 65.6%, a difference of 0.91%.
College, 1 year or more Correlation Summary
| Measurement | Estonian | Immigrants from Denmark |
| Minimum | 25.8% | 23.5% |
| Maximum | 100.0% | 85.2% |
| Range | 74.2% | 61.6% |
| Mean | 62.4% | 64.0% |
| Median | 63.5% | 65.5% |
| Interquartile 25% (IQ1) | 53.0% | 58.1% |
| Interquartile 75% (IQ3) | 70.8% | 72.3% |
| Interquartile Range (IQR) | 17.8% | 14.1% |
| Standard Deviation (Sample) | 14.5% | 13.3% |
| Standard Deviation (Population) | 14.4% | 13.1% |
Demographics Similar to Estonians and Immigrants from Denmark by College, 1 year or more
In terms of college, 1 year or more, the demographic groups most similar to Estonians are Immigrants from Kuwait (65.0%, a difference of 0.060%), Immigrants from Saudi Arabia (65.0%, a difference of 0.070%), Russian (65.1%, a difference of 0.22%), Immigrants from South Africa (65.1%, a difference of 0.23%), and Mongolian (64.8%, a difference of 0.26%). Similarly, the demographic groups most similar to Immigrants from Denmark are Turkish (65.5%, a difference of 0.080%), Immigrants from Northern Europe (65.6%, a difference of 0.11%), Bulgarian (65.5%, a difference of 0.13%), Immigrants from Sri Lanka (65.4%, a difference of 0.28%), and Immigrants from France (65.8%, a difference of 0.36%).
| Demographics | Rating | Rank | College, 1 year or more |
| Immigrants | Belgium | 100.0 /100 | #24 | Exceptional 66.3% |
| Indians (Asian) | 100.0 /100 | #25 | Exceptional 66.1% |
| Latvians | 100.0 /100 | #26 | Exceptional 66.1% |
| Immigrants | Ireland | 100.0 /100 | #27 | Exceptional 65.9% |
| Immigrants | France | 100.0 /100 | #28 | Exceptional 65.8% |
| Immigrants | Northern Europe | 100.0 /100 | #29 | Exceptional 65.6% |
| Immigrants | Denmark | 100.0 /100 | #30 | Exceptional 65.6% |
| Turks | 100.0 /100 | #31 | Exceptional 65.5% |
| Bulgarians | 100.0 /100 | #32 | Exceptional 65.5% |
| Immigrants | Sri Lanka | 99.9 /100 | #33 | Exceptional 65.4% |
| Israelis | 99.9 /100 | #34 | Exceptional 65.3% |
| Immigrants | Turkey | 99.9 /100 | #35 | Exceptional 65.2% |
| Immigrants | South Africa | 99.9 /100 | #36 | Exceptional 65.1% |
| Russians | 99.9 /100 | #37 | Exceptional 65.1% |
| Immigrants | Saudi Arabia | 99.9 /100 | #38 | Exceptional 65.0% |
| Estonians | 99.9 /100 | #39 | Exceptional 65.0% |
| Immigrants | Kuwait | 99.9 /100 | #40 | Exceptional 65.0% |
| Mongolians | 99.9 /100 | #41 | Exceptional 64.8% |
| Immigrants | Latvia | 99.9 /100 | #42 | Exceptional 64.8% |
| Immigrants | Russia | 99.9 /100 | #43 | Exceptional 64.7% |
| Immigrants | Norway | 99.9 /100 | #44 | Exceptional 64.7% |