Celtic vs Immigrants from Romania Associate's Degree
COMPARE
Celtic
Immigrants from Romania
Associate's Degree
Associate's Degree Comparison
Celtics
Immigrants from Romania
45.8%
ASSOCIATE'S DEGREE
33.3/ 100
METRIC RATING
192nd/ 347
METRIC RANK
50.9%
ASSOCIATE'S DEGREE
99.5/ 100
METRIC RATING
71st/ 347
METRIC RANK
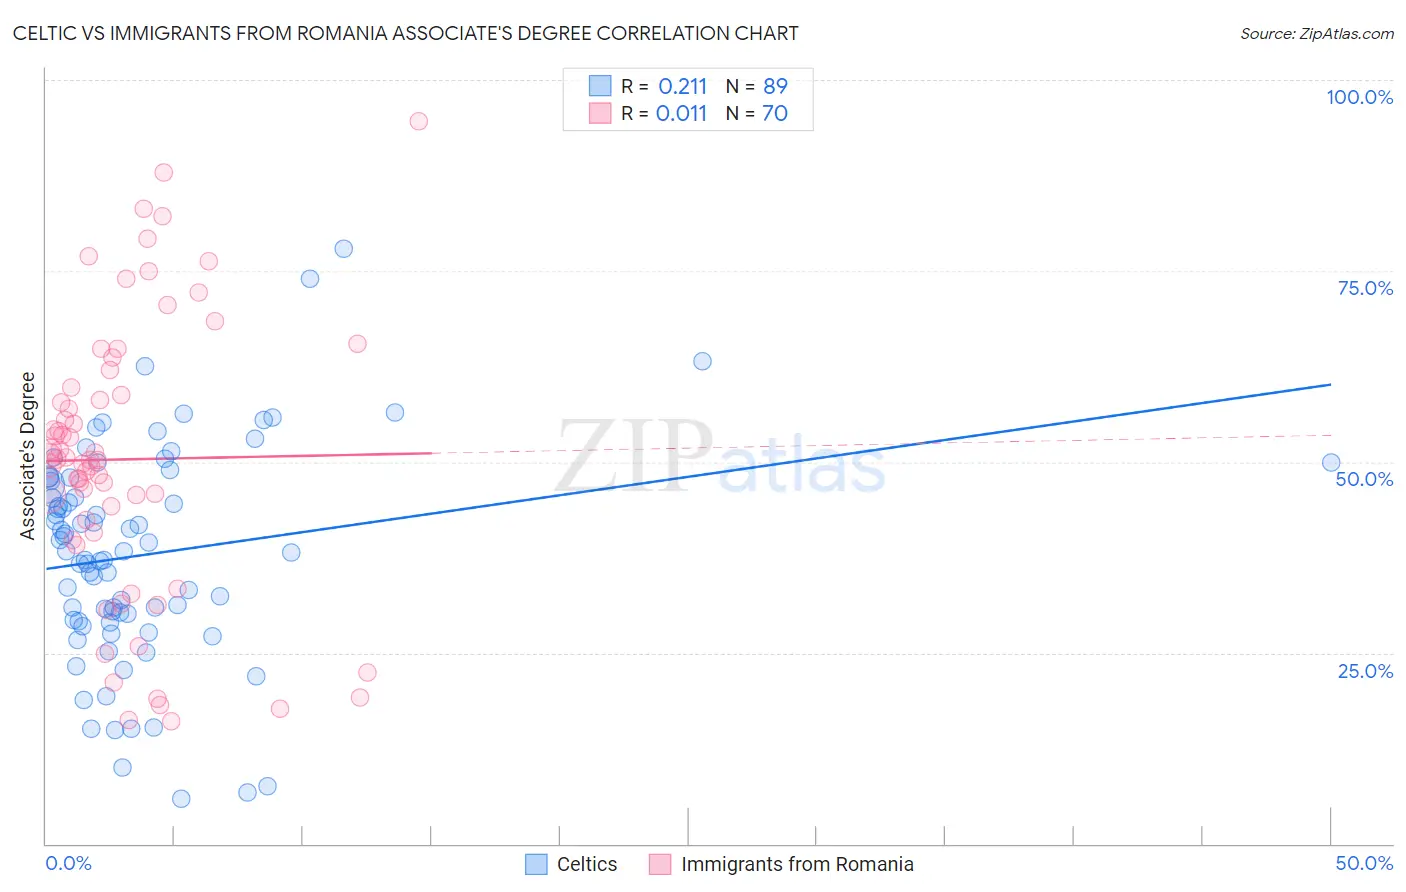
Celtic vs Immigrants from Romania Associate's Degree Correlation Chart
The statistical analysis conducted on geographies consisting of 168,877,276 people shows a weak positive correlation between the proportion of Celtics and percentage of population with at least associate's degree education in the United States with a correlation coefficient (R) of 0.211 and weighted average of 45.8%. Similarly, the statistical analysis conducted on geographies consisting of 257,014,107 people shows no correlation between the proportion of Immigrants from Romania and percentage of population with at least associate's degree education in the United States with a correlation coefficient (R) of 0.011 and weighted average of 50.9%, a difference of 11.3%.
Associate's Degree Correlation Summary
| Measurement | Celtic | Immigrants from Romania |
| Minimum | 5.9% | 16.1% |
| Maximum | 77.9% | 94.5% |
| Range | 72.0% | 78.4% |
| Mean | 37.9% | 50.3% |
| Median | 38.3% | 50.3% |
| Interquartile 25% (IQ1) | 29.3% | 40.7% |
| Interquartile 75% (IQ3) | 47.8% | 59.7% |
| Interquartile Range (IQR) | 18.5% | 19.1% |
| Standard Deviation (Sample) | 14.1% | 18.2% |
| Standard Deviation (Population) | 14.0% | 18.1% |
Similar Demographics by Associate's Degree
Demographics Similar to Celtics by Associate's Degree
In terms of associate's degree, the demographic groups most similar to Celtics are Korean (45.8%, a difference of 0.050%), Vietnamese (45.8%, a difference of 0.060%), Immigrants from Oceania (45.8%, a difference of 0.12%), Immigrants from Uruguay (45.8%, a difference of 0.18%), and Ghanaian (45.8%, a difference of 0.18%).
| Demographics | Rating | Rank | Associate's Degree |
| Costa Ricans | 38.6 /100 | #185 | Fair 46.0% |
| Welsh | 37.9 /100 | #186 | Fair 45.9% |
| Immigrants | Uruguay | 35.5 /100 | #187 | Fair 45.8% |
| Ghanaians | 35.5 /100 | #188 | Fair 45.8% |
| Immigrants | Oceania | 34.7 /100 | #189 | Fair 45.8% |
| Vietnamese | 34.0 /100 | #190 | Fair 45.8% |
| Koreans | 33.8 /100 | #191 | Fair 45.8% |
| Celtics | 33.3 /100 | #192 | Fair 45.8% |
| Immigrants | Cameroon | 31.0 /100 | #193 | Fair 45.7% |
| Immigrants | Peru | 27.6 /100 | #194 | Fair 45.5% |
| Germans | 26.5 /100 | #195 | Fair 45.5% |
| French | 25.6 /100 | #196 | Fair 45.4% |
| Scotch-Irish | 22.3 /100 | #197 | Fair 45.3% |
| Immigrants | Bangladesh | 21.3 /100 | #198 | Fair 45.2% |
| Immigrants | Senegal | 21.2 /100 | #199 | Fair 45.2% |
Demographics Similar to Immigrants from Romania by Associate's Degree
In terms of associate's degree, the demographic groups most similar to Immigrants from Romania are Immigrants from Argentina (50.9%, a difference of 0.010%), Egyptian (50.9%, a difference of 0.040%), Immigrants from Pakistan (50.9%, a difference of 0.060%), Immigrants from Indonesia (51.0%, a difference of 0.16%), and Carpatho Rusyn (50.6%, a difference of 0.53%).
| Demographics | Rating | Rank | Associate's Degree |
| Immigrants | Netherlands | 99.7 /100 | #64 | Exceptional 51.4% |
| Zimbabweans | 99.7 /100 | #65 | Exceptional 51.3% |
| Immigrants | Europe | 99.7 /100 | #66 | Exceptional 51.3% |
| Argentineans | 99.6 /100 | #67 | Exceptional 51.2% |
| Immigrants | Indonesia | 99.5 /100 | #68 | Exceptional 51.0% |
| Egyptians | 99.5 /100 | #69 | Exceptional 50.9% |
| Immigrants | Argentina | 99.5 /100 | #70 | Exceptional 50.9% |
| Immigrants | Romania | 99.5 /100 | #71 | Exceptional 50.9% |
| Immigrants | Pakistan | 99.5 /100 | #72 | Exceptional 50.9% |
| Carpatho Rusyns | 99.3 /100 | #73 | Exceptional 50.6% |
| Lithuanians | 99.3 /100 | #74 | Exceptional 50.6% |
| Immigrants | Scotland | 99.3 /100 | #75 | Exceptional 50.6% |
| Immigrants | Zimbabwe | 99.2 /100 | #76 | Exceptional 50.5% |
| Immigrants | Lebanon | 99.1 /100 | #77 | Exceptional 50.5% |
| Immigrants | Eastern Europe | 99.1 /100 | #78 | Exceptional 50.5% |