Celtic vs Immigrants from Uganda Associate's Degree
COMPARE
Celtic
Immigrants from Uganda
Associate's Degree
Associate's Degree Comparison
Celtics
Immigrants from Uganda
45.8%
ASSOCIATE'S DEGREE
33.3/ 100
METRIC RATING
192nd/ 347
METRIC RANK
48.5%
ASSOCIATE'S DEGREE
92.1/ 100
METRIC RATING
127th/ 347
METRIC RANK
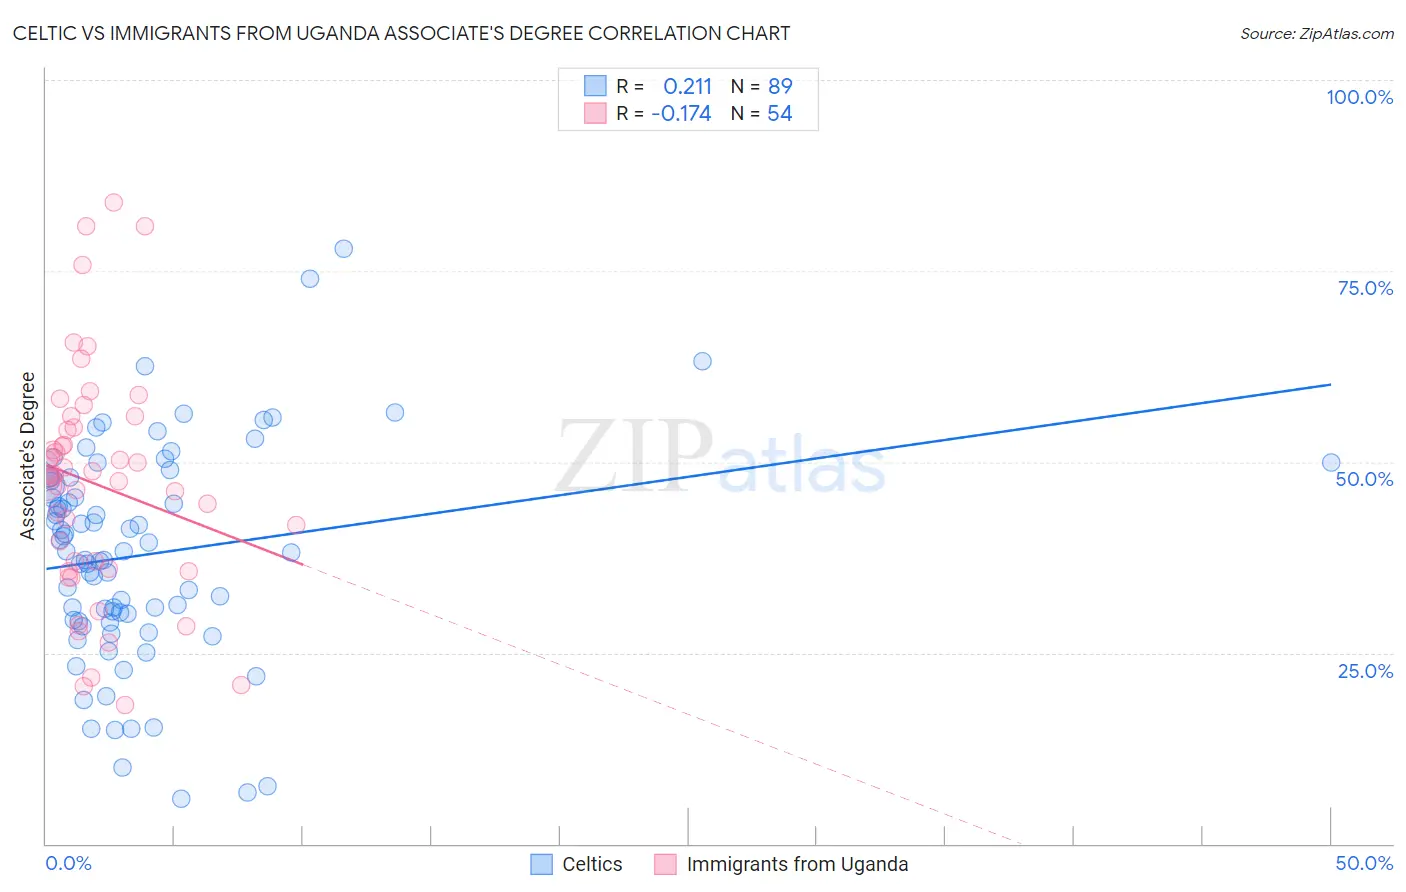
Celtic vs Immigrants from Uganda Associate's Degree Correlation Chart
The statistical analysis conducted on geographies consisting of 168,877,276 people shows a weak positive correlation between the proportion of Celtics and percentage of population with at least associate's degree education in the United States with a correlation coefficient (R) of 0.211 and weighted average of 45.8%. Similarly, the statistical analysis conducted on geographies consisting of 125,982,535 people shows a poor negative correlation between the proportion of Immigrants from Uganda and percentage of population with at least associate's degree education in the United States with a correlation coefficient (R) of -0.174 and weighted average of 48.5%, a difference of 6.0%.
Associate's Degree Correlation Summary
| Measurement | Celtic | Immigrants from Uganda |
| Minimum | 5.9% | 18.1% |
| Maximum | 77.9% | 84.0% |
| Range | 72.0% | 65.9% |
| Mean | 37.9% | 47.0% |
| Median | 38.3% | 48.2% |
| Interquartile 25% (IQ1) | 29.3% | 36.0% |
| Interquartile 75% (IQ3) | 47.8% | 54.5% |
| Interquartile Range (IQR) | 18.5% | 18.5% |
| Standard Deviation (Sample) | 14.1% | 15.0% |
| Standard Deviation (Population) | 14.0% | 14.9% |
Similar Demographics by Associate's Degree
Demographics Similar to Celtics by Associate's Degree
In terms of associate's degree, the demographic groups most similar to Celtics are Korean (45.8%, a difference of 0.050%), Vietnamese (45.8%, a difference of 0.060%), Immigrants from Oceania (45.8%, a difference of 0.12%), Immigrants from Uruguay (45.8%, a difference of 0.18%), and Ghanaian (45.8%, a difference of 0.18%).
| Demographics | Rating | Rank | Associate's Degree |
| Costa Ricans | 38.6 /100 | #185 | Fair 46.0% |
| Welsh | 37.9 /100 | #186 | Fair 45.9% |
| Immigrants | Uruguay | 35.5 /100 | #187 | Fair 45.8% |
| Ghanaians | 35.5 /100 | #188 | Fair 45.8% |
| Immigrants | Oceania | 34.7 /100 | #189 | Fair 45.8% |
| Vietnamese | 34.0 /100 | #190 | Fair 45.8% |
| Koreans | 33.8 /100 | #191 | Fair 45.8% |
| Celtics | 33.3 /100 | #192 | Fair 45.8% |
| Immigrants | Cameroon | 31.0 /100 | #193 | Fair 45.7% |
| Immigrants | Peru | 27.6 /100 | #194 | Fair 45.5% |
| Germans | 26.5 /100 | #195 | Fair 45.5% |
| French | 25.6 /100 | #196 | Fair 45.4% |
| Scotch-Irish | 22.3 /100 | #197 | Fair 45.3% |
| Immigrants | Bangladesh | 21.3 /100 | #198 | Fair 45.2% |
| Immigrants | Senegal | 21.2 /100 | #199 | Fair 45.2% |
Demographics Similar to Immigrants from Uganda by Associate's Degree
In terms of associate's degree, the demographic groups most similar to Immigrants from Uganda are Immigrants from Syria (48.5%, a difference of 0.010%), Chinese (48.5%, a difference of 0.10%), Serbian (48.5%, a difference of 0.12%), Immigrants from Eastern Africa (48.4%, a difference of 0.12%), and Swedish (48.4%, a difference of 0.15%).
| Demographics | Rating | Rank | Associate's Degree |
| Alsatians | 94.6 /100 | #120 | Exceptional 48.8% |
| Ugandans | 93.9 /100 | #121 | Exceptional 48.7% |
| Italians | 93.9 /100 | #122 | Exceptional 48.7% |
| Brazilians | 93.7 /100 | #123 | Exceptional 48.7% |
| Serbians | 92.6 /100 | #124 | Exceptional 48.5% |
| Chinese | 92.5 /100 | #125 | Exceptional 48.5% |
| Immigrants | Syria | 92.2 /100 | #126 | Exceptional 48.5% |
| Immigrants | Uganda | 92.1 /100 | #127 | Exceptional 48.5% |
| Immigrants | Eastern Africa | 91.6 /100 | #128 | Exceptional 48.4% |
| Swedes | 91.5 /100 | #129 | Exceptional 48.4% |
| Immigrants | Jordan | 91.2 /100 | #130 | Exceptional 48.4% |
| Icelanders | 90.8 /100 | #131 | Exceptional 48.3% |
| Immigrants | Albania | 89.9 /100 | #132 | Excellent 48.2% |
| Assyrians/Chaldeans/Syriacs | 89.4 /100 | #133 | Excellent 48.2% |
| Moroccans | 89.3 /100 | #134 | Excellent 48.2% |