Celtic vs Australian Associate's Degree
COMPARE
Celtic
Australian
Associate's Degree
Associate's Degree Comparison
Celtics
Australians
45.8%
ASSOCIATE'S DEGREE
33.3/ 100
METRIC RATING
192nd/ 347
METRIC RANK
51.9%
ASSOCIATE'S DEGREE
99.8/ 100
METRIC RATING
55th/ 347
METRIC RANK
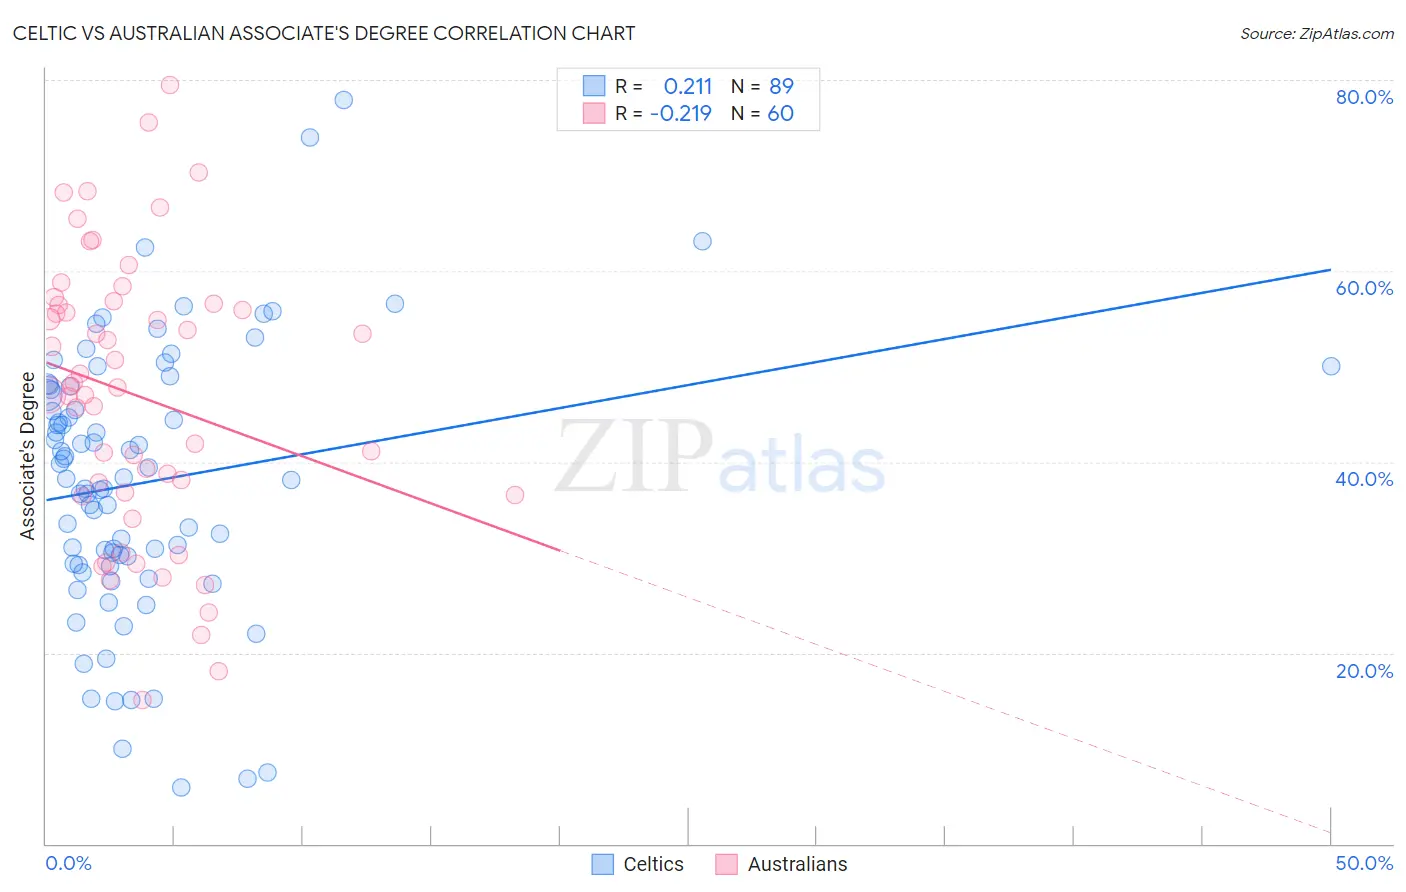
Celtic vs Australian Associate's Degree Correlation Chart
The statistical analysis conducted on geographies consisting of 168,877,276 people shows a weak positive correlation between the proportion of Celtics and percentage of population with at least associate's degree education in the United States with a correlation coefficient (R) of 0.211 and weighted average of 45.8%. Similarly, the statistical analysis conducted on geographies consisting of 224,144,542 people shows a weak negative correlation between the proportion of Australians and percentage of population with at least associate's degree education in the United States with a correlation coefficient (R) of -0.219 and weighted average of 51.9%, a difference of 13.4%.
Associate's Degree Correlation Summary
| Measurement | Celtic | Australian |
| Minimum | 5.9% | 15.1% |
| Maximum | 77.9% | 79.5% |
| Range | 72.0% | 64.4% |
| Mean | 37.9% | 47.0% |
| Median | 38.3% | 47.9% |
| Interquartile 25% (IQ1) | 29.3% | 36.7% |
| Interquartile 75% (IQ3) | 47.8% | 56.5% |
| Interquartile Range (IQR) | 18.5% | 19.8% |
| Standard Deviation (Sample) | 14.1% | 14.6% |
| Standard Deviation (Population) | 14.0% | 14.4% |
Similar Demographics by Associate's Degree
Demographics Similar to Celtics by Associate's Degree
In terms of associate's degree, the demographic groups most similar to Celtics are Korean (45.8%, a difference of 0.050%), Vietnamese (45.8%, a difference of 0.060%), Immigrants from Oceania (45.8%, a difference of 0.12%), Immigrants from Uruguay (45.8%, a difference of 0.18%), and Ghanaian (45.8%, a difference of 0.18%).
| Demographics | Rating | Rank | Associate's Degree |
| Costa Ricans | 38.6 /100 | #185 | Fair 46.0% |
| Welsh | 37.9 /100 | #186 | Fair 45.9% |
| Immigrants | Uruguay | 35.5 /100 | #187 | Fair 45.8% |
| Ghanaians | 35.5 /100 | #188 | Fair 45.8% |
| Immigrants | Oceania | 34.7 /100 | #189 | Fair 45.8% |
| Vietnamese | 34.0 /100 | #190 | Fair 45.8% |
| Koreans | 33.8 /100 | #191 | Fair 45.8% |
| Celtics | 33.3 /100 | #192 | Fair 45.8% |
| Immigrants | Cameroon | 31.0 /100 | #193 | Fair 45.7% |
| Immigrants | Peru | 27.6 /100 | #194 | Fair 45.5% |
| Germans | 26.5 /100 | #195 | Fair 45.5% |
| French | 25.6 /100 | #196 | Fair 45.4% |
| Scotch-Irish | 22.3 /100 | #197 | Fair 45.3% |
| Immigrants | Bangladesh | 21.3 /100 | #198 | Fair 45.2% |
| Immigrants | Senegal | 21.2 /100 | #199 | Fair 45.2% |
Demographics Similar to Australians by Associate's Degree
In terms of associate's degree, the demographic groups most similar to Australians are Immigrants from Czechoslovakia (51.9%, a difference of 0.020%), Immigrants from Spain (51.9%, a difference of 0.030%), Immigrants from Asia (52.0%, a difference of 0.13%), Paraguayan (51.8%, a difference of 0.14%), and Bolivian (52.0%, a difference of 0.16%).
| Demographics | Rating | Rank | Associate's Degree |
| Immigrants | Norway | 99.9 /100 | #48 | Exceptional 52.2% |
| Immigrants | Austria | 99.9 /100 | #49 | Exceptional 52.1% |
| Asians | 99.9 /100 | #50 | Exceptional 52.1% |
| Immigrants | Greece | 99.9 /100 | #51 | Exceptional 52.1% |
| Bolivians | 99.8 /100 | #52 | Exceptional 52.0% |
| Immigrants | Asia | 99.8 /100 | #53 | Exceptional 52.0% |
| Immigrants | Spain | 99.8 /100 | #54 | Exceptional 51.9% |
| Australians | 99.8 /100 | #55 | Exceptional 51.9% |
| Immigrants | Czechoslovakia | 99.8 /100 | #56 | Exceptional 51.9% |
| Paraguayans | 99.8 /100 | #57 | Exceptional 51.8% |
| New Zealanders | 99.8 /100 | #58 | Exceptional 51.8% |
| Immigrants | Serbia | 99.8 /100 | #59 | Exceptional 51.7% |
| Immigrants | Bolivia | 99.7 /100 | #60 | Exceptional 51.5% |
| Immigrants | Kazakhstan | 99.7 /100 | #61 | Exceptional 51.4% |
| Bhutanese | 99.7 /100 | #62 | Exceptional 51.4% |