Canadian vs Immigrants from Sierra Leone College, 1 year or more
COMPARE
Canadian
Immigrants from Sierra Leone
College, 1 year or more
College, 1 year or more Comparison
Canadians
Immigrants from Sierra Leone
60.6%
COLLEGE, 1 YEAR OR MORE
82.7/ 100
METRIC RATING
143rd/ 347
METRIC RANK
59.5%
COLLEGE, 1 YEAR OR MORE
52.2/ 100
METRIC RATING
172nd/ 347
METRIC RANK
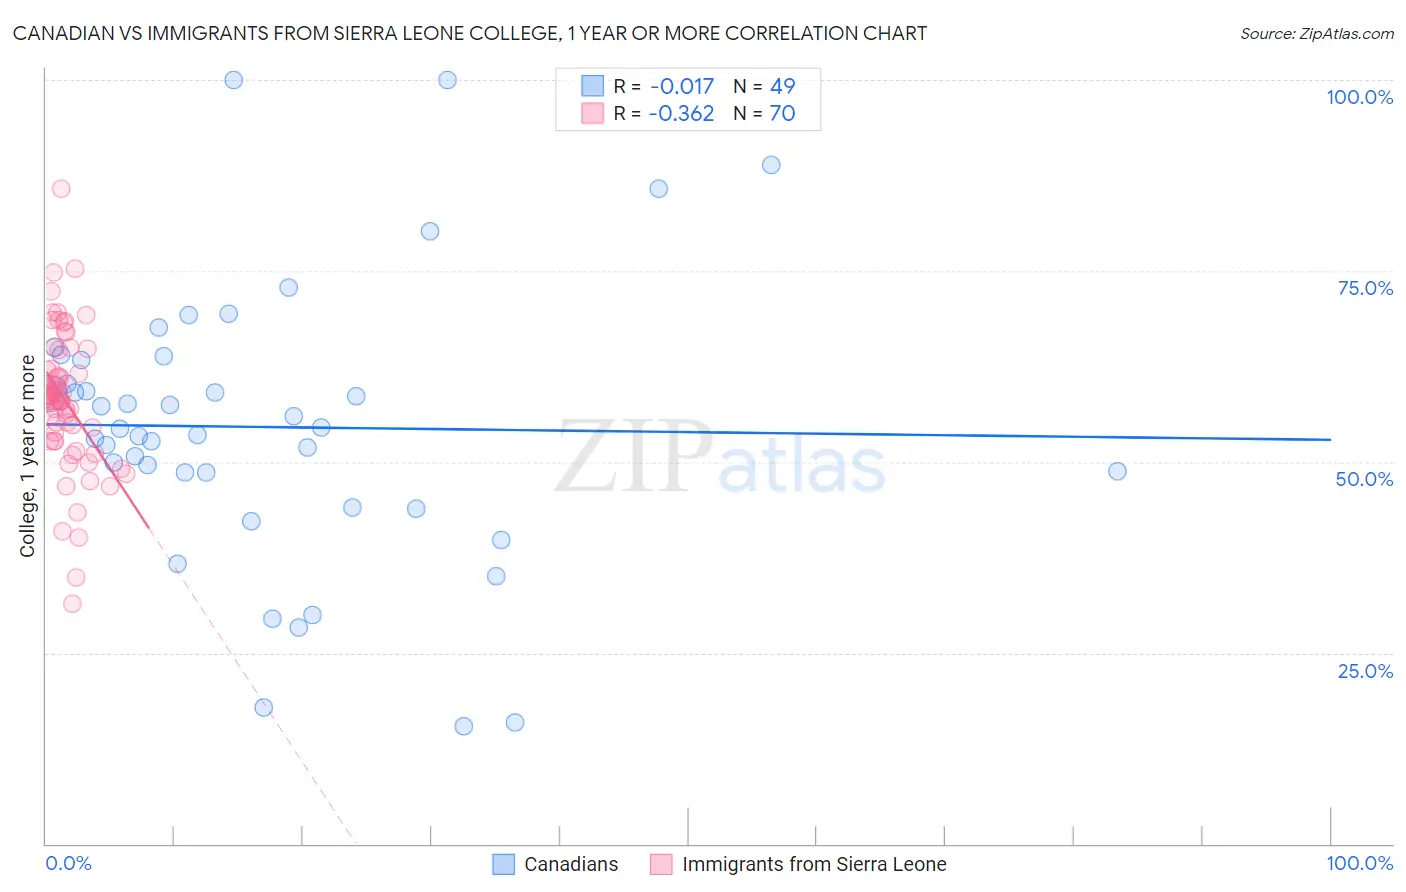
Canadian vs Immigrants from Sierra Leone College, 1 year or more Correlation Chart
The statistical analysis conducted on geographies consisting of 437,551,933 people shows no correlation between the proportion of Canadians and percentage of population with at least college, 1 year or more education in the United States with a correlation coefficient (R) of -0.017 and weighted average of 60.6%. Similarly, the statistical analysis conducted on geographies consisting of 101,652,497 people shows a mild negative correlation between the proportion of Immigrants from Sierra Leone and percentage of population with at least college, 1 year or more education in the United States with a correlation coefficient (R) of -0.362 and weighted average of 59.5%, a difference of 2.0%.
College, 1 year or more Correlation Summary
| Measurement | Canadian | Immigrants from Sierra Leone |
| Minimum | 15.4% | 31.4% |
| Maximum | 100.0% | 85.8% |
| Range | 84.6% | 54.4% |
| Mean | 54.6% | 58.1% |
| Median | 54.3% | 58.6% |
| Interquartile 25% (IQ1) | 46.3% | 52.7% |
| Interquartile 75% (IQ3) | 63.6% | 62.1% |
| Interquartile Range (IQR) | 17.4% | 9.4% |
| Standard Deviation (Sample) | 18.4% | 9.2% |
| Standard Deviation (Population) | 18.2% | 9.2% |
Similar Demographics by College, 1 year or more
Demographics Similar to Canadians by College, 1 year or more
In terms of college, 1 year or more, the demographic groups most similar to Canadians are Polish (60.7%, a difference of 0.010%), Immigrants from Afghanistan (60.7%, a difference of 0.040%), Iraqi (60.7%, a difference of 0.050%), Czech (60.6%, a difference of 0.080%), and Slavic (60.6%, a difference of 0.14%).
| Demographics | Rating | Rank | College, 1 year or more |
| Basques | 87.2 /100 | #136 | Excellent 60.9% |
| Slovenes | 86.5 /100 | #137 | Excellent 60.9% |
| Taiwanese | 84.3 /100 | #138 | Excellent 60.7% |
| Immigrants | Eritrea | 84.3 /100 | #139 | Excellent 60.7% |
| Iraqis | 83.3 /100 | #140 | Excellent 60.7% |
| Immigrants | Afghanistan | 83.1 /100 | #141 | Excellent 60.7% |
| Poles | 82.8 /100 | #142 | Excellent 60.7% |
| Canadians | 82.7 /100 | #143 | Excellent 60.6% |
| Czechs | 81.9 /100 | #144 | Excellent 60.6% |
| Slavs | 81.1 /100 | #145 | Excellent 60.6% |
| Scottish | 80.2 /100 | #146 | Excellent 60.5% |
| Immigrants | Kenya | 79.1 /100 | #147 | Good 60.5% |
| Kenyans | 79.0 /100 | #148 | Good 60.5% |
| Brazilians | 79.0 /100 | #149 | Good 60.5% |
| Immigrants | Sudan | 77.8 /100 | #150 | Good 60.4% |
Demographics Similar to Immigrants from Sierra Leone by College, 1 year or more
In terms of college, 1 year or more, the demographic groups most similar to Immigrants from Sierra Leone are Welsh (59.5%, a difference of 0.010%), Immigrants from Albania (59.5%, a difference of 0.010%), Immigrants from Southern Europe (59.5%, a difference of 0.030%), Hungarian (59.5%, a difference of 0.040%), and Immigrants from North Macedonia (59.5%, a difference of 0.050%).
| Demographics | Rating | Rank | College, 1 year or more |
| Irish | 56.1 /100 | #165 | Average 59.6% |
| Immigrants | Africa | 56.1 /100 | #166 | Average 59.6% |
| Immigrants | North Macedonia | 53.1 /100 | #167 | Average 59.5% |
| Hungarians | 52.9 /100 | #168 | Average 59.5% |
| Immigrants | Southern Europe | 52.7 /100 | #169 | Average 59.5% |
| Welsh | 52.4 /100 | #170 | Average 59.5% |
| Immigrants | Albania | 52.3 /100 | #171 | Average 59.5% |
| Immigrants | Sierra Leone | 52.2 /100 | #172 | Average 59.5% |
| Immigrants | Oceania | 51.2 /100 | #173 | Average 59.4% |
| Celtics | 50.0 /100 | #174 | Average 59.4% |
| Sri Lankans | 49.0 /100 | #175 | Average 59.4% |
| Immigrants | Poland | 48.9 /100 | #176 | Average 59.4% |
| Tlingit-Haida | 48.4 /100 | #177 | Average 59.4% |
| Czechoslovakians | 48.3 /100 | #178 | Average 59.4% |
| Bermudans | 46.6 /100 | #179 | Average 59.3% |