Canadian vs Menominee College, 1 year or more
COMPARE
Canadian
Menominee
College, 1 year or more
College, 1 year or more Comparison
Canadians
Menominee
60.6%
COLLEGE, 1 YEAR OR MORE
82.7/ 100
METRIC RATING
143rd/ 347
METRIC RANK
50.6%
COLLEGE, 1 YEAR OR MORE
0.0/ 100
METRIC RATING
327th/ 347
METRIC RANK
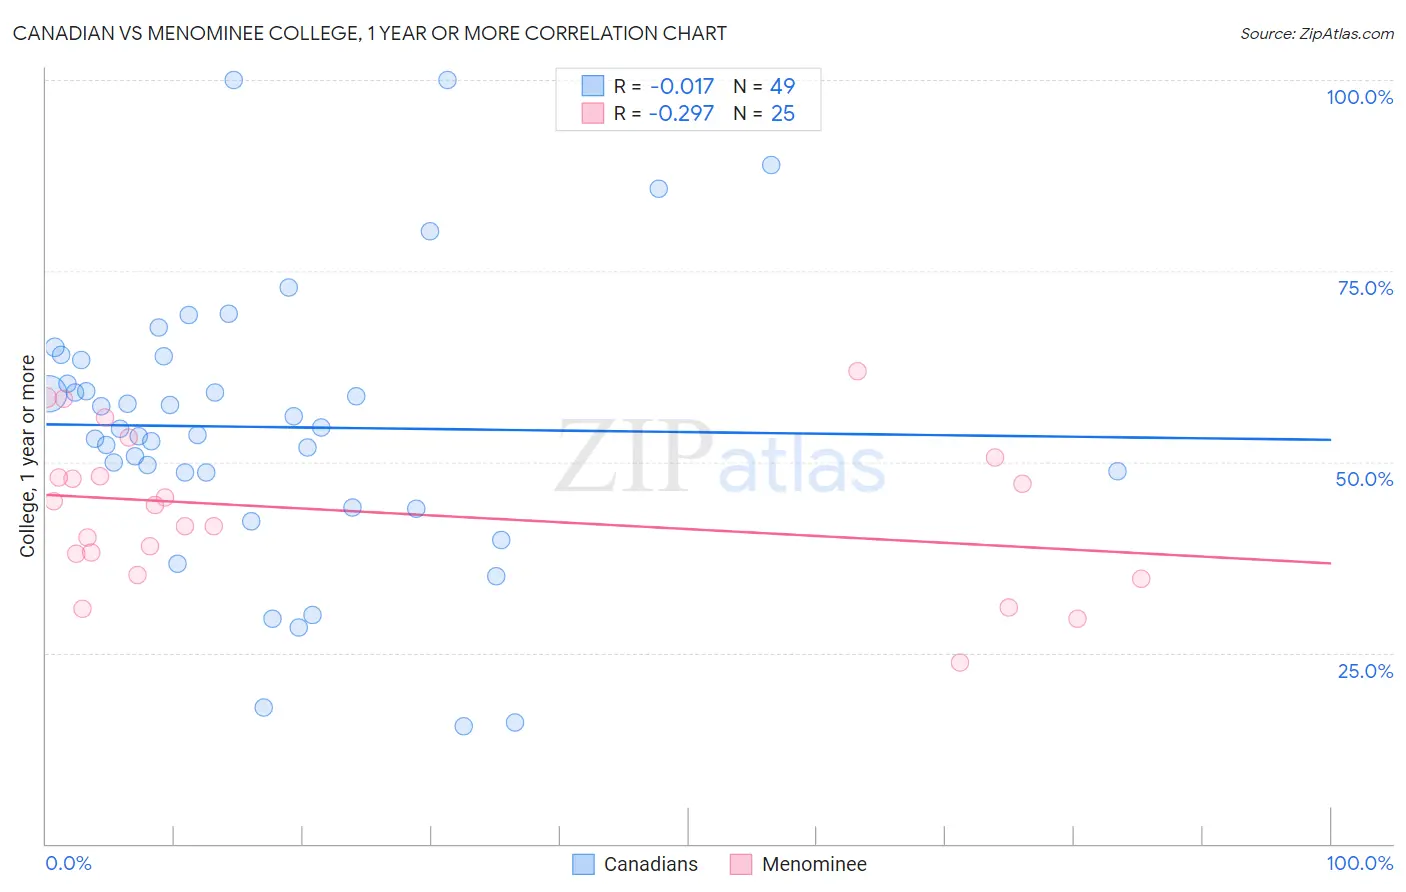
Canadian vs Menominee College, 1 year or more Correlation Chart
The statistical analysis conducted on geographies consisting of 437,551,933 people shows no correlation between the proportion of Canadians and percentage of population with at least college, 1 year or more education in the United States with a correlation coefficient (R) of -0.017 and weighted average of 60.6%. Similarly, the statistical analysis conducted on geographies consisting of 45,778,860 people shows a weak negative correlation between the proportion of Menominee and percentage of population with at least college, 1 year or more education in the United States with a correlation coefficient (R) of -0.297 and weighted average of 50.6%, a difference of 19.9%.
College, 1 year or more Correlation Summary
| Measurement | Canadian | Menominee |
| Minimum | 15.4% | 23.8% |
| Maximum | 100.0% | 61.9% |
| Range | 84.6% | 38.1% |
| Mean | 54.6% | 43.5% |
| Median | 54.3% | 44.3% |
| Interquartile 25% (IQ1) | 46.3% | 36.6% |
| Interquartile 75% (IQ3) | 63.6% | 49.3% |
| Interquartile Range (IQR) | 17.4% | 12.7% |
| Standard Deviation (Sample) | 18.4% | 9.8% |
| Standard Deviation (Population) | 18.2% | 9.6% |
Similar Demographics by College, 1 year or more
Demographics Similar to Canadians by College, 1 year or more
In terms of college, 1 year or more, the demographic groups most similar to Canadians are Polish (60.7%, a difference of 0.010%), Immigrants from Afghanistan (60.7%, a difference of 0.040%), Iraqi (60.7%, a difference of 0.050%), Czech (60.6%, a difference of 0.080%), and Slavic (60.6%, a difference of 0.14%).
| Demographics | Rating | Rank | College, 1 year or more |
| Basques | 87.2 /100 | #136 | Excellent 60.9% |
| Slovenes | 86.5 /100 | #137 | Excellent 60.9% |
| Taiwanese | 84.3 /100 | #138 | Excellent 60.7% |
| Immigrants | Eritrea | 84.3 /100 | #139 | Excellent 60.7% |
| Iraqis | 83.3 /100 | #140 | Excellent 60.7% |
| Immigrants | Afghanistan | 83.1 /100 | #141 | Excellent 60.7% |
| Poles | 82.8 /100 | #142 | Excellent 60.7% |
| Canadians | 82.7 /100 | #143 | Excellent 60.6% |
| Czechs | 81.9 /100 | #144 | Excellent 60.6% |
| Slavs | 81.1 /100 | #145 | Excellent 60.6% |
| Scottish | 80.2 /100 | #146 | Excellent 60.5% |
| Immigrants | Kenya | 79.1 /100 | #147 | Good 60.5% |
| Kenyans | 79.0 /100 | #148 | Good 60.5% |
| Brazilians | 79.0 /100 | #149 | Good 60.5% |
| Immigrants | Sudan | 77.8 /100 | #150 | Good 60.4% |
Demographics Similar to Menominee by College, 1 year or more
In terms of college, 1 year or more, the demographic groups most similar to Menominee are Dominican (50.6%, a difference of 0.040%), Dutch West Indian (50.5%, a difference of 0.12%), Immigrants from Latin America (50.7%, a difference of 0.22%), Immigrants from Cuba (50.7%, a difference of 0.25%), and Immigrants from Guatemala (50.7%, a difference of 0.26%).
| Demographics | Rating | Rank | College, 1 year or more |
| Kiowa | 0.0 /100 | #320 | Tragic 51.0% |
| Hopi | 0.0 /100 | #321 | Tragic 50.9% |
| Navajo | 0.0 /100 | #322 | Tragic 50.8% |
| Immigrants | Guatemala | 0.0 /100 | #323 | Tragic 50.7% |
| Immigrants | Cuba | 0.0 /100 | #324 | Tragic 50.7% |
| Immigrants | Latin America | 0.0 /100 | #325 | Tragic 50.7% |
| Dominicans | 0.0 /100 | #326 | Tragic 50.6% |
| Menominee | 0.0 /100 | #327 | Tragic 50.6% |
| Dutch West Indians | 0.0 /100 | #328 | Tragic 50.5% |
| Cape Verdeans | 0.0 /100 | #329 | Tragic 50.3% |
| Natives/Alaskans | 0.0 /100 | #330 | Tragic 50.2% |
| Immigrants | Yemen | 0.0 /100 | #331 | Tragic 50.0% |
| Mexicans | 0.0 /100 | #332 | Tragic 49.2% |
| Immigrants | Dominican Republic | 0.0 /100 | #333 | Tragic 49.1% |
| Lumbee | 0.0 /100 | #334 | Tragic 48.9% |