Canadian vs Immigrants from Yemen College, 1 year or more
COMPARE
Canadian
Immigrants from Yemen
College, 1 year or more
College, 1 year or more Comparison
Canadians
Immigrants from Yemen
60.6%
COLLEGE, 1 YEAR OR MORE
82.7/ 100
METRIC RATING
143rd/ 347
METRIC RANK
50.0%
COLLEGE, 1 YEAR OR MORE
0.0/ 100
METRIC RATING
331st/ 347
METRIC RANK
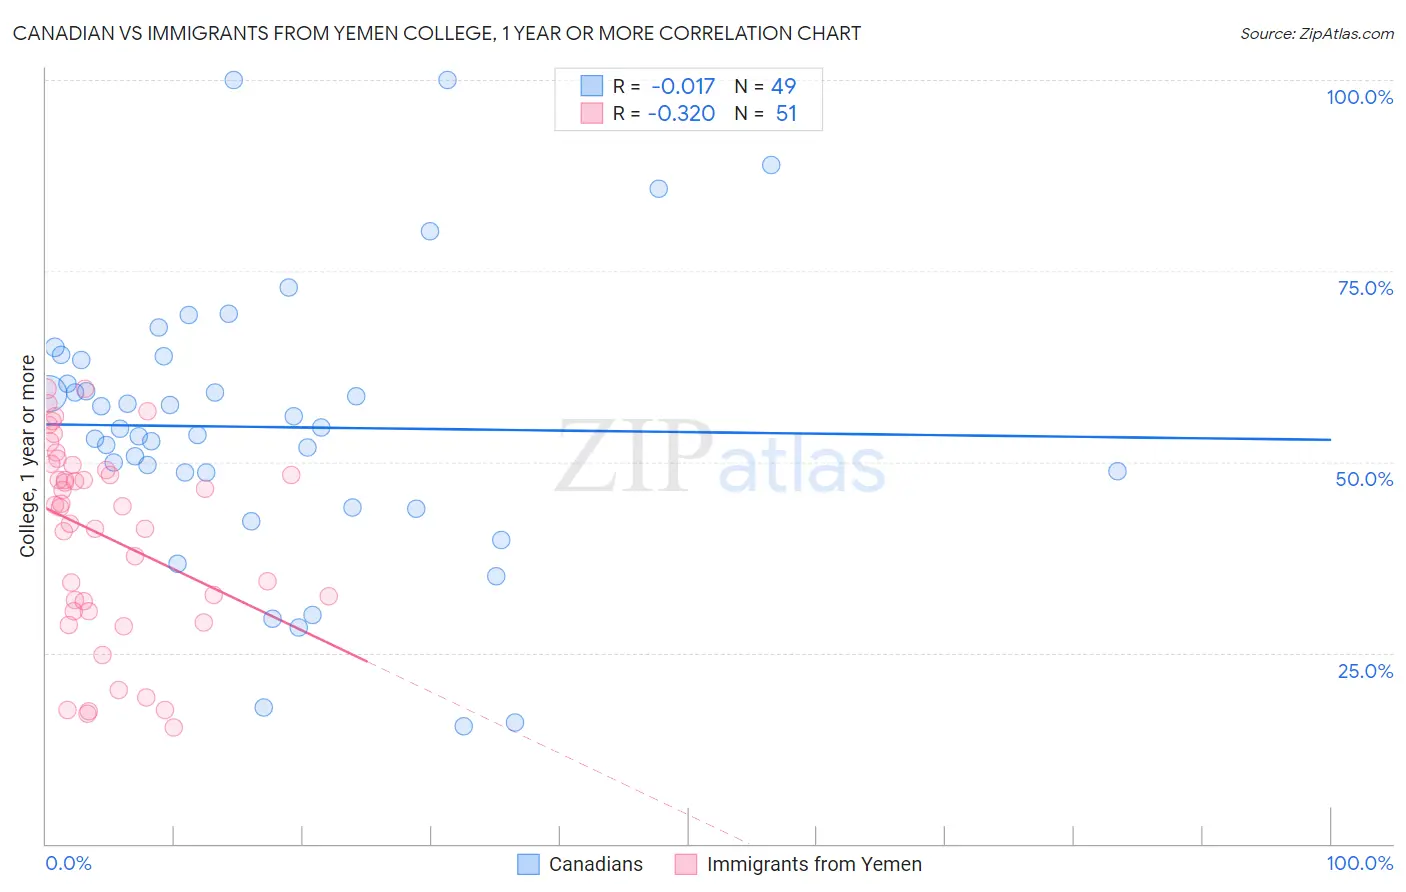
Canadian vs Immigrants from Yemen College, 1 year or more Correlation Chart
The statistical analysis conducted on geographies consisting of 437,551,933 people shows no correlation between the proportion of Canadians and percentage of population with at least college, 1 year or more education in the United States with a correlation coefficient (R) of -0.017 and weighted average of 60.6%. Similarly, the statistical analysis conducted on geographies consisting of 82,433,611 people shows a mild negative correlation between the proportion of Immigrants from Yemen and percentage of population with at least college, 1 year or more education in the United States with a correlation coefficient (R) of -0.320 and weighted average of 50.0%, a difference of 21.2%.
College, 1 year or more Correlation Summary
| Measurement | Canadian | Immigrants from Yemen |
| Minimum | 15.4% | 15.2% |
| Maximum | 100.0% | 59.5% |
| Range | 84.6% | 44.4% |
| Mean | 54.6% | 40.3% |
| Median | 54.3% | 44.2% |
| Interquartile 25% (IQ1) | 46.3% | 30.5% |
| Interquartile 75% (IQ3) | 63.6% | 49.5% |
| Interquartile Range (IQR) | 17.4% | 19.0% |
| Standard Deviation (Sample) | 18.4% | 12.7% |
| Standard Deviation (Population) | 18.2% | 12.6% |
Similar Demographics by College, 1 year or more
Demographics Similar to Canadians by College, 1 year or more
In terms of college, 1 year or more, the demographic groups most similar to Canadians are Polish (60.7%, a difference of 0.010%), Immigrants from Afghanistan (60.7%, a difference of 0.040%), Iraqi (60.7%, a difference of 0.050%), Czech (60.6%, a difference of 0.080%), and Slavic (60.6%, a difference of 0.14%).
| Demographics | Rating | Rank | College, 1 year or more |
| Basques | 87.2 /100 | #136 | Excellent 60.9% |
| Slovenes | 86.5 /100 | #137 | Excellent 60.9% |
| Taiwanese | 84.3 /100 | #138 | Excellent 60.7% |
| Immigrants | Eritrea | 84.3 /100 | #139 | Excellent 60.7% |
| Iraqis | 83.3 /100 | #140 | Excellent 60.7% |
| Immigrants | Afghanistan | 83.1 /100 | #141 | Excellent 60.7% |
| Poles | 82.8 /100 | #142 | Excellent 60.7% |
| Canadians | 82.7 /100 | #143 | Excellent 60.6% |
| Czechs | 81.9 /100 | #144 | Excellent 60.6% |
| Slavs | 81.1 /100 | #145 | Excellent 60.6% |
| Scottish | 80.2 /100 | #146 | Excellent 60.5% |
| Immigrants | Kenya | 79.1 /100 | #147 | Good 60.5% |
| Kenyans | 79.0 /100 | #148 | Good 60.5% |
| Brazilians | 79.0 /100 | #149 | Good 60.5% |
| Immigrants | Sudan | 77.8 /100 | #150 | Good 60.4% |
Demographics Similar to Immigrants from Yemen by College, 1 year or more
In terms of college, 1 year or more, the demographic groups most similar to Immigrants from Yemen are Native/Alaskan (50.2%, a difference of 0.35%), Cape Verdean (50.3%, a difference of 0.57%), Dutch West Indian (50.5%, a difference of 0.97%), Menominee (50.6%, a difference of 1.1%), and Dominican (50.6%, a difference of 1.1%).
| Demographics | Rating | Rank | College, 1 year or more |
| Immigrants | Cuba | 0.0 /100 | #324 | Tragic 50.7% |
| Immigrants | Latin America | 0.0 /100 | #325 | Tragic 50.7% |
| Dominicans | 0.0 /100 | #326 | Tragic 50.6% |
| Menominee | 0.0 /100 | #327 | Tragic 50.6% |
| Dutch West Indians | 0.0 /100 | #328 | Tragic 50.5% |
| Cape Verdeans | 0.0 /100 | #329 | Tragic 50.3% |
| Natives/Alaskans | 0.0 /100 | #330 | Tragic 50.2% |
| Immigrants | Yemen | 0.0 /100 | #331 | Tragic 50.0% |
| Mexicans | 0.0 /100 | #332 | Tragic 49.2% |
| Immigrants | Dominican Republic | 0.0 /100 | #333 | Tragic 49.1% |
| Lumbee | 0.0 /100 | #334 | Tragic 48.9% |
| Yuman | 0.0 /100 | #335 | Tragic 48.7% |
| Spanish American Indians | 0.0 /100 | #336 | Tragic 48.5% |
| Pennsylvania Germans | 0.0 /100 | #337 | Tragic 48.5% |
| Immigrants | Central America | 0.0 /100 | #338 | Tragic 48.5% |