Canadian vs Immigrants from Chile College, 1 year or more
COMPARE
Canadian
Immigrants from Chile
College, 1 year or more
College, 1 year or more Comparison
Canadians
Immigrants from Chile
60.6%
COLLEGE, 1 YEAR OR MORE
82.7/ 100
METRIC RATING
143rd/ 347
METRIC RANK
61.4%
COLLEGE, 1 YEAR OR MORE
92.3/ 100
METRIC RATING
122nd/ 347
METRIC RANK
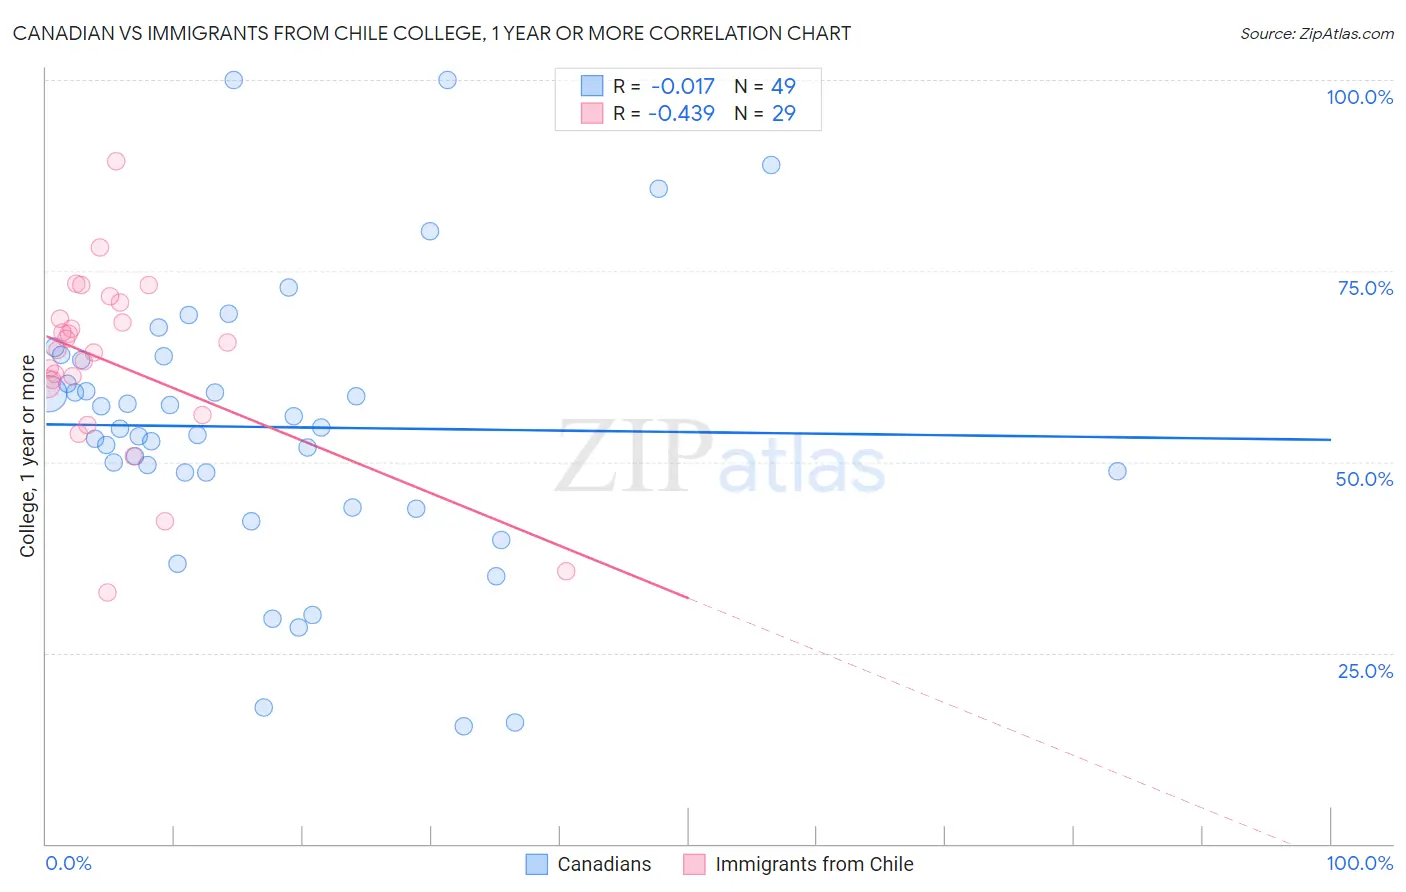
Canadian vs Immigrants from Chile College, 1 year or more Correlation Chart
The statistical analysis conducted on geographies consisting of 437,551,933 people shows no correlation between the proportion of Canadians and percentage of population with at least college, 1 year or more education in the United States with a correlation coefficient (R) of -0.017 and weighted average of 60.6%. Similarly, the statistical analysis conducted on geographies consisting of 218,647,266 people shows a moderate negative correlation between the proportion of Immigrants from Chile and percentage of population with at least college, 1 year or more education in the United States with a correlation coefficient (R) of -0.439 and weighted average of 61.4%, a difference of 1.2%.
College, 1 year or more Correlation Summary
| Measurement | Canadian | Immigrants from Chile |
| Minimum | 15.4% | 32.9% |
| Maximum | 100.0% | 89.4% |
| Range | 84.6% | 56.5% |
| Mean | 54.6% | 62.9% |
| Median | 54.3% | 64.7% |
| Interquartile 25% (IQ1) | 46.3% | 58.2% |
| Interquartile 75% (IQ3) | 63.6% | 69.8% |
| Interquartile Range (IQR) | 17.4% | 11.7% |
| Standard Deviation (Sample) | 18.4% | 11.9% |
| Standard Deviation (Population) | 18.2% | 11.7% |
Similar Demographics by College, 1 year or more
Demographics Similar to Canadians by College, 1 year or more
In terms of college, 1 year or more, the demographic groups most similar to Canadians are Polish (60.7%, a difference of 0.010%), Immigrants from Afghanistan (60.7%, a difference of 0.040%), Iraqi (60.7%, a difference of 0.050%), Czech (60.6%, a difference of 0.080%), and Slavic (60.6%, a difference of 0.14%).
| Demographics | Rating | Rank | College, 1 year or more |
| Basques | 87.2 /100 | #136 | Excellent 60.9% |
| Slovenes | 86.5 /100 | #137 | Excellent 60.9% |
| Taiwanese | 84.3 /100 | #138 | Excellent 60.7% |
| Immigrants | Eritrea | 84.3 /100 | #139 | Excellent 60.7% |
| Iraqis | 83.3 /100 | #140 | Excellent 60.7% |
| Immigrants | Afghanistan | 83.1 /100 | #141 | Excellent 60.7% |
| Poles | 82.8 /100 | #142 | Excellent 60.7% |
| Canadians | 82.7 /100 | #143 | Excellent 60.6% |
| Czechs | 81.9 /100 | #144 | Excellent 60.6% |
| Slavs | 81.1 /100 | #145 | Excellent 60.6% |
| Scottish | 80.2 /100 | #146 | Excellent 60.5% |
| Immigrants | Kenya | 79.1 /100 | #147 | Good 60.5% |
| Kenyans | 79.0 /100 | #148 | Good 60.5% |
| Brazilians | 79.0 /100 | #149 | Good 60.5% |
| Immigrants | Sudan | 77.8 /100 | #150 | Good 60.4% |
Demographics Similar to Immigrants from Chile by College, 1 year or more
In terms of college, 1 year or more, the demographic groups most similar to Immigrants from Chile are Serbian (61.4%, a difference of 0.010%), Venezuelan (61.3%, a difference of 0.040%), Immigrants from Jordan (61.4%, a difference of 0.080%), Immigrants from Syria (61.3%, a difference of 0.12%), and Alsatian (61.3%, a difference of 0.16%).
| Demographics | Rating | Rank | College, 1 year or more |
| Norwegians | 94.5 /100 | #115 | Exceptional 61.7% |
| Lebanese | 94.1 /100 | #116 | Exceptional 61.6% |
| Arabs | 93.9 /100 | #117 | Exceptional 61.6% |
| Immigrants | Brazil | 93.9 /100 | #118 | Exceptional 61.6% |
| Assyrians/Chaldeans/Syriacs | 93.3 /100 | #119 | Exceptional 61.5% |
| Pakistanis | 93.2 /100 | #120 | Exceptional 61.5% |
| Immigrants | Jordan | 92.7 /100 | #121 | Exceptional 61.4% |
| Immigrants | Chile | 92.3 /100 | #122 | Exceptional 61.4% |
| Serbians | 92.2 /100 | #123 | Exceptional 61.4% |
| Venezuelans | 92.1 /100 | #124 | Exceptional 61.3% |
| Immigrants | Syria | 91.6 /100 | #125 | Exceptional 61.3% |
| Alsatians | 91.3 /100 | #126 | Exceptional 61.3% |
| Immigrants | Eastern Africa | 91.1 /100 | #127 | Exceptional 61.2% |
| Immigrants | Italy | 91.1 /100 | #128 | Exceptional 61.2% |
| Ugandans | 90.7 /100 | #129 | Exceptional 61.2% |