Immigrants from Barbados vs Scandinavian College, 1 year or more
COMPARE
Immigrants from Barbados
Scandinavian
College, 1 year or more
College, 1 year or more Comparison
Immigrants from Barbados
Scandinavians
55.4%
COLLEGE, 1 YEAR OR MORE
0.6/ 100
METRIC RATING
253rd/ 347
METRIC RANK
61.0%
COLLEGE, 1 YEAR OR MORE
88.2/ 100
METRIC RATING
132nd/ 347
METRIC RANK
Immigrants from Barbados vs Scandinavian College, 1 year or more Correlation Chart
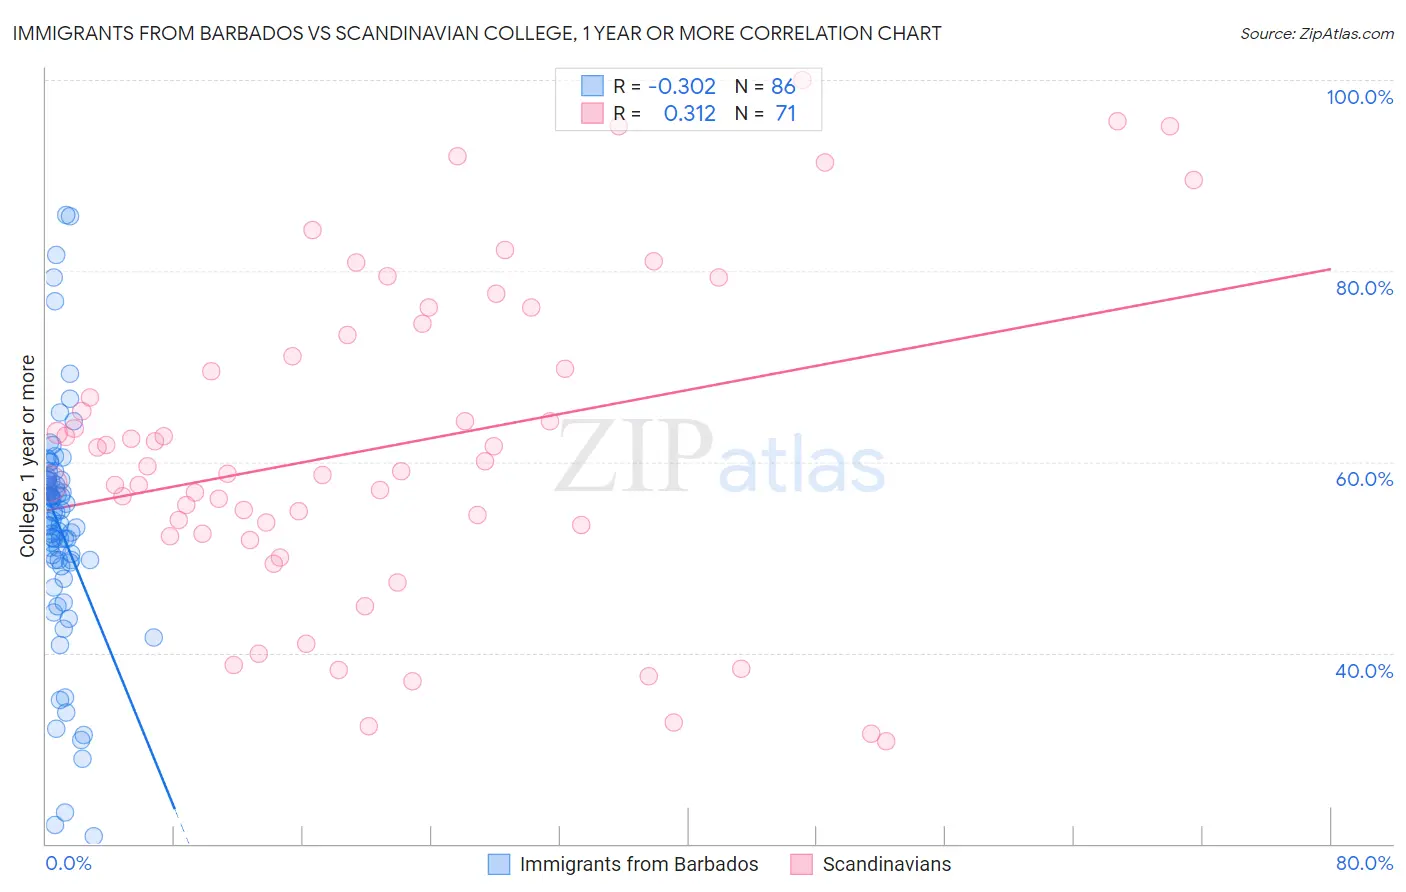
The statistical analysis conducted on geographies consisting of 112,783,541 people shows a mild negative correlation between the proportion of Immigrants from Barbados and percentage of population with at least college, 1 year or more education in the United States with a correlation coefficient (R) of -0.302 and weighted average of 55.4%. Similarly, the statistical analysis conducted on geographies consisting of 472,656,557 people shows a mild positive correlation between the proportion of Scandinavians and percentage of population with at least college, 1 year or more education in the United States with a correlation coefficient (R) of 0.312 and weighted average of 61.0%, a difference of 10.2%.
College, 1 year or more Correlation Summary
| Measurement | Immigrants from Barbados | Scandinavian |
| Minimum | 20.7% | 30.8% |
| Maximum | 85.8% | 100.0% |
| Range | 65.1% | 69.2% |
| Mean | 53.0% | 61.7% |
| Median | 53.8% | 59.5% |
| Interquartile 25% (IQ1) | 49.7% | 52.4% |
| Interquartile 75% (IQ3) | 58.1% | 73.2% |
| Interquartile Range (IQR) | 8.4% | 20.8% |
| Standard Deviation (Sample) | 12.1% | 16.9% |
| Standard Deviation (Population) | 12.1% | 16.7% |
Similar Demographics by College, 1 year or more
Demographics Similar to Immigrants from Barbados by College, 1 year or more
In terms of college, 1 year or more, the demographic groups most similar to Immigrants from Barbados are Aleut (55.4%, a difference of 0.11%), Immigrants from Cambodia (55.4%, a difference of 0.13%), Delaware (55.5%, a difference of 0.23%), Immigrants from Trinidad and Tobago (55.5%, a difference of 0.25%), and Japanese (55.2%, a difference of 0.25%).
| Demographics | Rating | Rank | College, 1 year or more |
| Malaysians | 0.8 /100 | #246 | Tragic 55.6% |
| Hawaiians | 0.8 /100 | #247 | Tragic 55.6% |
| Immigrants | Congo | 0.8 /100 | #248 | Tragic 55.6% |
| Immigrants | Trinidad and Tobago | 0.7 /100 | #249 | Tragic 55.5% |
| Delaware | 0.7 /100 | #250 | Tragic 55.5% |
| Immigrants | Cambodia | 0.6 /100 | #251 | Tragic 55.4% |
| Aleuts | 0.6 /100 | #252 | Tragic 55.4% |
| Immigrants | Barbados | 0.6 /100 | #253 | Tragic 55.4% |
| Japanese | 0.5 /100 | #254 | Tragic 55.2% |
| Immigrants | Bahamas | 0.5 /100 | #255 | Tragic 55.2% |
| Immigrants | West Indies | 0.5 /100 | #256 | Tragic 55.2% |
| Indonesians | 0.4 /100 | #257 | Tragic 55.1% |
| Africans | 0.4 /100 | #258 | Tragic 55.0% |
| Nepalese | 0.3 /100 | #259 | Tragic 54.9% |
| Jamaicans | 0.3 /100 | #260 | Tragic 54.9% |
Demographics Similar to Scandinavians by College, 1 year or more
In terms of college, 1 year or more, the demographic groups most similar to Scandinavians are Immigrants from Uzbekistan (61.0%, a difference of 0.030%), Immigrants from Venezuela (61.0%, a difference of 0.040%), Immigrants from Uganda (60.9%, a difference of 0.10%), Basque (60.9%, a difference of 0.12%), and Immigrants from Morocco (61.1%, a difference of 0.16%).
| Demographics | Rating | Rank | College, 1 year or more |
| Immigrants | Syria | 91.6 /100 | #125 | Exceptional 61.3% |
| Alsatians | 91.3 /100 | #126 | Exceptional 61.3% |
| Immigrants | Eastern Africa | 91.1 /100 | #127 | Exceptional 61.2% |
| Immigrants | Italy | 91.1 /100 | #128 | Exceptional 61.2% |
| Ugandans | 90.7 /100 | #129 | Exceptional 61.2% |
| Italians | 89.5 /100 | #130 | Excellent 61.1% |
| Immigrants | Morocco | 89.5 /100 | #131 | Excellent 61.1% |
| Scandinavians | 88.2 /100 | #132 | Excellent 61.0% |
| Immigrants | Uzbekistan | 88.0 /100 | #133 | Excellent 61.0% |
| Immigrants | Venezuela | 87.9 /100 | #134 | Excellent 61.0% |
| Immigrants | Uganda | 87.4 /100 | #135 | Excellent 60.9% |
| Basques | 87.2 /100 | #136 | Excellent 60.9% |
| Slovenes | 86.5 /100 | #137 | Excellent 60.9% |
| Taiwanese | 84.3 /100 | #138 | Excellent 60.7% |
| Immigrants | Eritrea | 84.3 /100 | #139 | Excellent 60.7% |