Canadian vs Haitian College, 1 year or more
COMPARE
Canadian
Haitian
College, 1 year or more
College, 1 year or more Comparison
Canadians
Haitians
60.6%
COLLEGE, 1 YEAR OR MORE
82.7/ 100
METRIC RATING
143rd/ 347
METRIC RANK
52.3%
COLLEGE, 1 YEAR OR MORE
0.0/ 100
METRIC RATING
301st/ 347
METRIC RANK
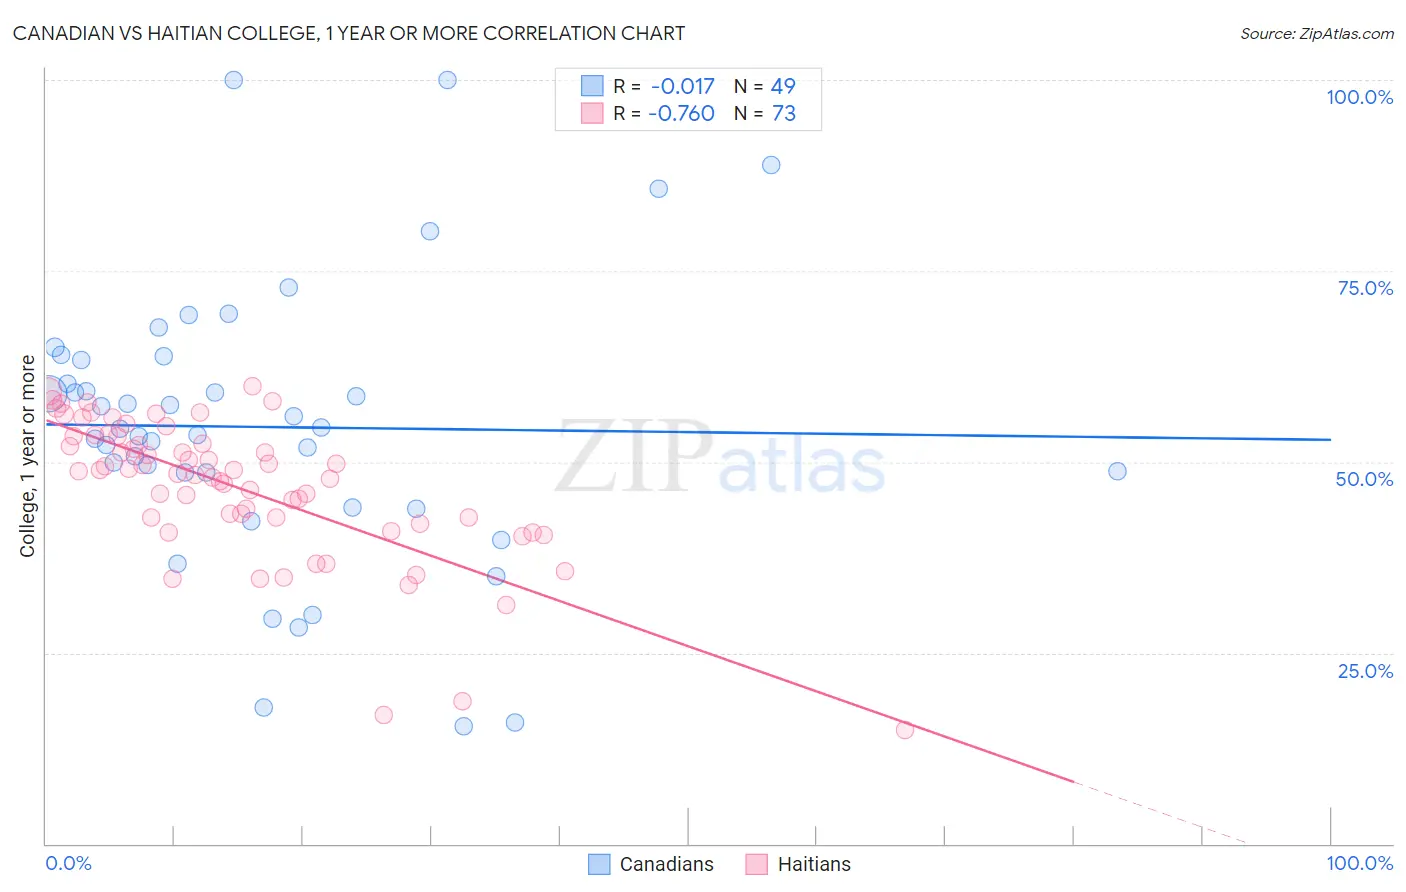
Canadian vs Haitian College, 1 year or more Correlation Chart
The statistical analysis conducted on geographies consisting of 437,551,933 people shows no correlation between the proportion of Canadians and percentage of population with at least college, 1 year or more education in the United States with a correlation coefficient (R) of -0.017 and weighted average of 60.6%. Similarly, the statistical analysis conducted on geographies consisting of 288,015,465 people shows a strong negative correlation between the proportion of Haitians and percentage of population with at least college, 1 year or more education in the United States with a correlation coefficient (R) of -0.760 and weighted average of 52.3%, a difference of 15.9%.
College, 1 year or more Correlation Summary
| Measurement | Canadian | Haitian |
| Minimum | 15.4% | 14.8% |
| Maximum | 100.0% | 59.9% |
| Range | 84.6% | 45.1% |
| Mean | 54.6% | 46.6% |
| Median | 54.3% | 48.7% |
| Interquartile 25% (IQ1) | 46.3% | 42.3% |
| Interquartile 75% (IQ3) | 63.6% | 53.4% |
| Interquartile Range (IQR) | 17.4% | 11.1% |
| Standard Deviation (Sample) | 18.4% | 9.4% |
| Standard Deviation (Population) | 18.2% | 9.3% |
Similar Demographics by College, 1 year or more
Demographics Similar to Canadians by College, 1 year or more
In terms of college, 1 year or more, the demographic groups most similar to Canadians are Polish (60.7%, a difference of 0.010%), Immigrants from Afghanistan (60.7%, a difference of 0.040%), Iraqi (60.7%, a difference of 0.050%), Czech (60.6%, a difference of 0.080%), and Slavic (60.6%, a difference of 0.14%).
| Demographics | Rating | Rank | College, 1 year or more |
| Basques | 87.2 /100 | #136 | Excellent 60.9% |
| Slovenes | 86.5 /100 | #137 | Excellent 60.9% |
| Taiwanese | 84.3 /100 | #138 | Excellent 60.7% |
| Immigrants | Eritrea | 84.3 /100 | #139 | Excellent 60.7% |
| Iraqis | 83.3 /100 | #140 | Excellent 60.7% |
| Immigrants | Afghanistan | 83.1 /100 | #141 | Excellent 60.7% |
| Poles | 82.8 /100 | #142 | Excellent 60.7% |
| Canadians | 82.7 /100 | #143 | Excellent 60.6% |
| Czechs | 81.9 /100 | #144 | Excellent 60.6% |
| Slavs | 81.1 /100 | #145 | Excellent 60.6% |
| Scottish | 80.2 /100 | #146 | Excellent 60.5% |
| Immigrants | Kenya | 79.1 /100 | #147 | Good 60.5% |
| Kenyans | 79.0 /100 | #148 | Good 60.5% |
| Brazilians | 79.0 /100 | #149 | Good 60.5% |
| Immigrants | Sudan | 77.8 /100 | #150 | Good 60.4% |
Demographics Similar to Haitians by College, 1 year or more
In terms of college, 1 year or more, the demographic groups most similar to Haitians are Choctaw (52.3%, a difference of 0.060%), Immigrants from Nicaragua (52.4%, a difference of 0.10%), Puerto Rican (52.2%, a difference of 0.13%), Creek (52.2%, a difference of 0.21%), and Central American (52.1%, a difference of 0.34%).
| Demographics | Rating | Rank | College, 1 year or more |
| Cherokee | 0.0 /100 | #294 | Tragic 53.2% |
| Yaqui | 0.0 /100 | #295 | Tragic 53.2% |
| Sioux | 0.0 /100 | #296 | Tragic 53.0% |
| Paiute | 0.0 /100 | #297 | Tragic 52.9% |
| Immigrants | Dominica | 0.0 /100 | #298 | Tragic 52.5% |
| Immigrants | Nicaragua | 0.0 /100 | #299 | Tragic 52.4% |
| Choctaw | 0.0 /100 | #300 | Tragic 52.3% |
| Haitians | 0.0 /100 | #301 | Tragic 52.3% |
| Puerto Ricans | 0.0 /100 | #302 | Tragic 52.2% |
| Creek | 0.0 /100 | #303 | Tragic 52.2% |
| Central Americans | 0.0 /100 | #304 | Tragic 52.1% |
| Seminole | 0.0 /100 | #305 | Tragic 52.1% |
| Mexican American Indians | 0.0 /100 | #306 | Tragic 51.9% |
| Immigrants | Portugal | 0.0 /100 | #307 | Tragic 51.9% |
| Salvadorans | 0.0 /100 | #308 | Tragic 51.8% |