Paiute vs Scandinavian College, 1 year or more
COMPARE
Paiute
Scandinavian
College, 1 year or more
College, 1 year or more Comparison
Paiute
Scandinavians
52.9%
COLLEGE, 1 YEAR OR MORE
0.0/ 100
METRIC RATING
297th/ 347
METRIC RANK
61.0%
COLLEGE, 1 YEAR OR MORE
88.2/ 100
METRIC RATING
132nd/ 347
METRIC RANK
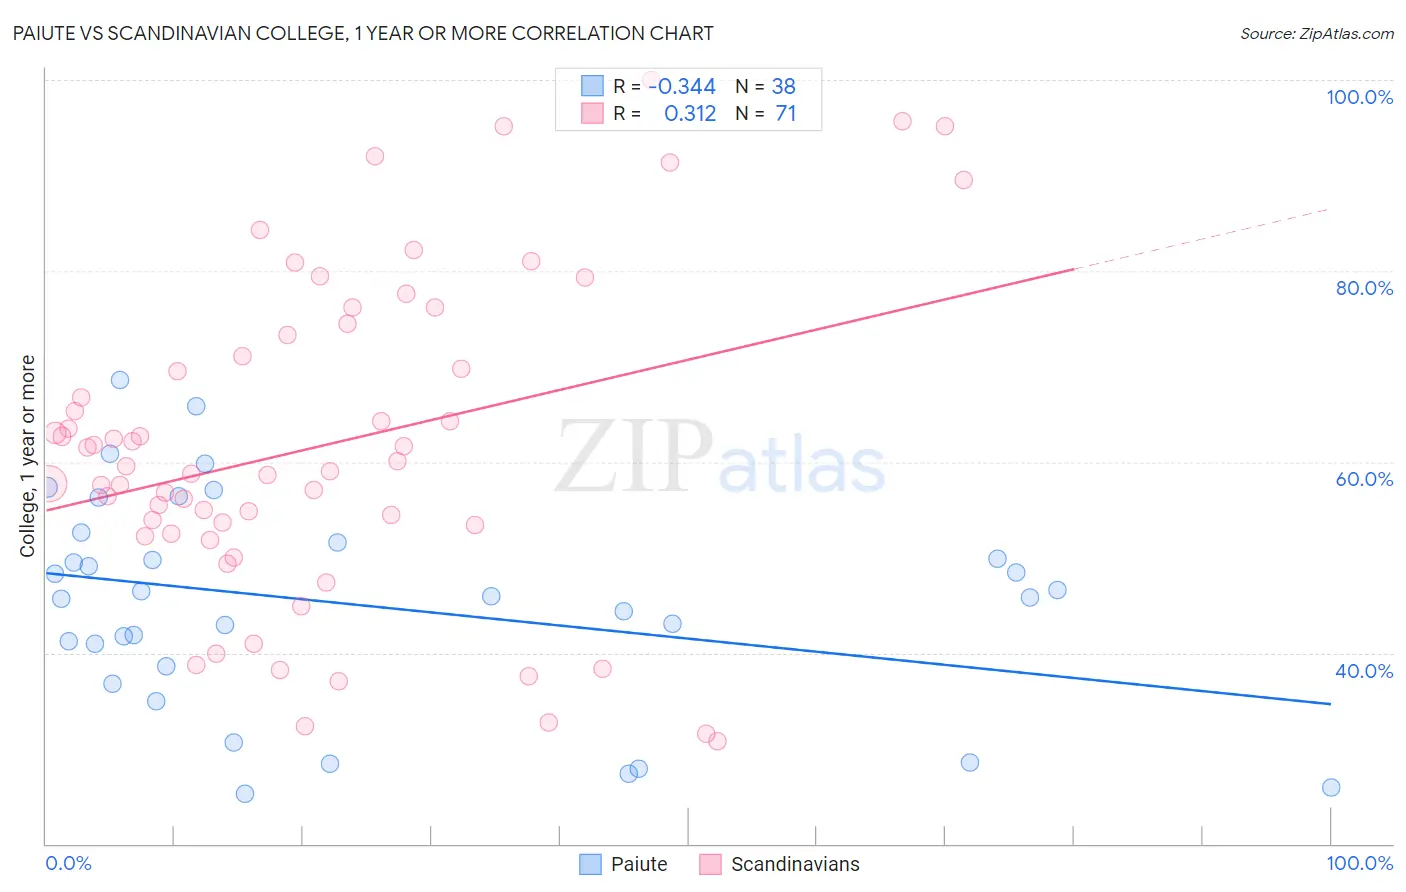
Paiute vs Scandinavian College, 1 year or more Correlation Chart
The statistical analysis conducted on geographies consisting of 58,404,248 people shows a mild negative correlation between the proportion of Paiute and percentage of population with at least college, 1 year or more education in the United States with a correlation coefficient (R) of -0.344 and weighted average of 52.9%. Similarly, the statistical analysis conducted on geographies consisting of 472,656,557 people shows a mild positive correlation between the proportion of Scandinavians and percentage of population with at least college, 1 year or more education in the United States with a correlation coefficient (R) of 0.312 and weighted average of 61.0%, a difference of 15.4%.
College, 1 year or more Correlation Summary
| Measurement | Paiute | Scandinavian |
| Minimum | 25.3% | 30.8% |
| Maximum | 68.6% | 100.0% |
| Range | 43.4% | 69.2% |
| Mean | 45.0% | 61.7% |
| Median | 45.9% | 59.5% |
| Interquartile 25% (IQ1) | 38.5% | 52.4% |
| Interquartile 75% (IQ3) | 51.5% | 73.2% |
| Interquartile Range (IQR) | 13.0% | 20.8% |
| Standard Deviation (Sample) | 11.2% | 16.9% |
| Standard Deviation (Population) | 11.0% | 16.7% |
Similar Demographics by College, 1 year or more
Demographics Similar to Paiute by College, 1 year or more
In terms of college, 1 year or more, the demographic groups most similar to Paiute are Sioux (53.0%, a difference of 0.28%), Immigrants from Dominica (52.5%, a difference of 0.59%), Yaqui (53.2%, a difference of 0.62%), Cherokee (53.2%, a difference of 0.63%), and Black/African American (53.3%, a difference of 0.84%).
| Demographics | Rating | Rank | College, 1 year or more |
| Alaskan Athabascans | 0.0 /100 | #290 | Tragic 53.4% |
| Cubans | 0.0 /100 | #291 | Tragic 53.4% |
| Chickasaw | 0.0 /100 | #292 | Tragic 53.3% |
| Blacks/African Americans | 0.0 /100 | #293 | Tragic 53.3% |
| Cherokee | 0.0 /100 | #294 | Tragic 53.2% |
| Yaqui | 0.0 /100 | #295 | Tragic 53.2% |
| Sioux | 0.0 /100 | #296 | Tragic 53.0% |
| Paiute | 0.0 /100 | #297 | Tragic 52.9% |
| Immigrants | Dominica | 0.0 /100 | #298 | Tragic 52.5% |
| Immigrants | Nicaragua | 0.0 /100 | #299 | Tragic 52.4% |
| Choctaw | 0.0 /100 | #300 | Tragic 52.3% |
| Haitians | 0.0 /100 | #301 | Tragic 52.3% |
| Puerto Ricans | 0.0 /100 | #302 | Tragic 52.2% |
| Creek | 0.0 /100 | #303 | Tragic 52.2% |
| Central Americans | 0.0 /100 | #304 | Tragic 52.1% |
Demographics Similar to Scandinavians by College, 1 year or more
In terms of college, 1 year or more, the demographic groups most similar to Scandinavians are Immigrants from Uzbekistan (61.0%, a difference of 0.030%), Immigrants from Venezuela (61.0%, a difference of 0.040%), Immigrants from Uganda (60.9%, a difference of 0.10%), Basque (60.9%, a difference of 0.12%), and Immigrants from Morocco (61.1%, a difference of 0.16%).
| Demographics | Rating | Rank | College, 1 year or more |
| Immigrants | Syria | 91.6 /100 | #125 | Exceptional 61.3% |
| Alsatians | 91.3 /100 | #126 | Exceptional 61.3% |
| Immigrants | Eastern Africa | 91.1 /100 | #127 | Exceptional 61.2% |
| Immigrants | Italy | 91.1 /100 | #128 | Exceptional 61.2% |
| Ugandans | 90.7 /100 | #129 | Exceptional 61.2% |
| Italians | 89.5 /100 | #130 | Excellent 61.1% |
| Immigrants | Morocco | 89.5 /100 | #131 | Excellent 61.1% |
| Scandinavians | 88.2 /100 | #132 | Excellent 61.0% |
| Immigrants | Uzbekistan | 88.0 /100 | #133 | Excellent 61.0% |
| Immigrants | Venezuela | 87.9 /100 | #134 | Excellent 61.0% |
| Immigrants | Uganda | 87.4 /100 | #135 | Excellent 60.9% |
| Basques | 87.2 /100 | #136 | Excellent 60.9% |
| Slovenes | 86.5 /100 | #137 | Excellent 60.9% |
| Taiwanese | 84.3 /100 | #138 | Excellent 60.7% |
| Immigrants | Eritrea | 84.3 /100 | #139 | Excellent 60.7% |