Burmese vs Immigrants from Sri Lanka College, 1 year or more
COMPARE
Burmese
Immigrants from Sri Lanka
College, 1 year or more
College, 1 year or more Comparison
Burmese
Immigrants from Sri Lanka
66.7%
COLLEGE, 1 YEAR OR MORE
100.0/ 100
METRIC RATING
14th/ 347
METRIC RANK
65.4%
COLLEGE, 1 YEAR OR MORE
99.9/ 100
METRIC RATING
33rd/ 347
METRIC RANK
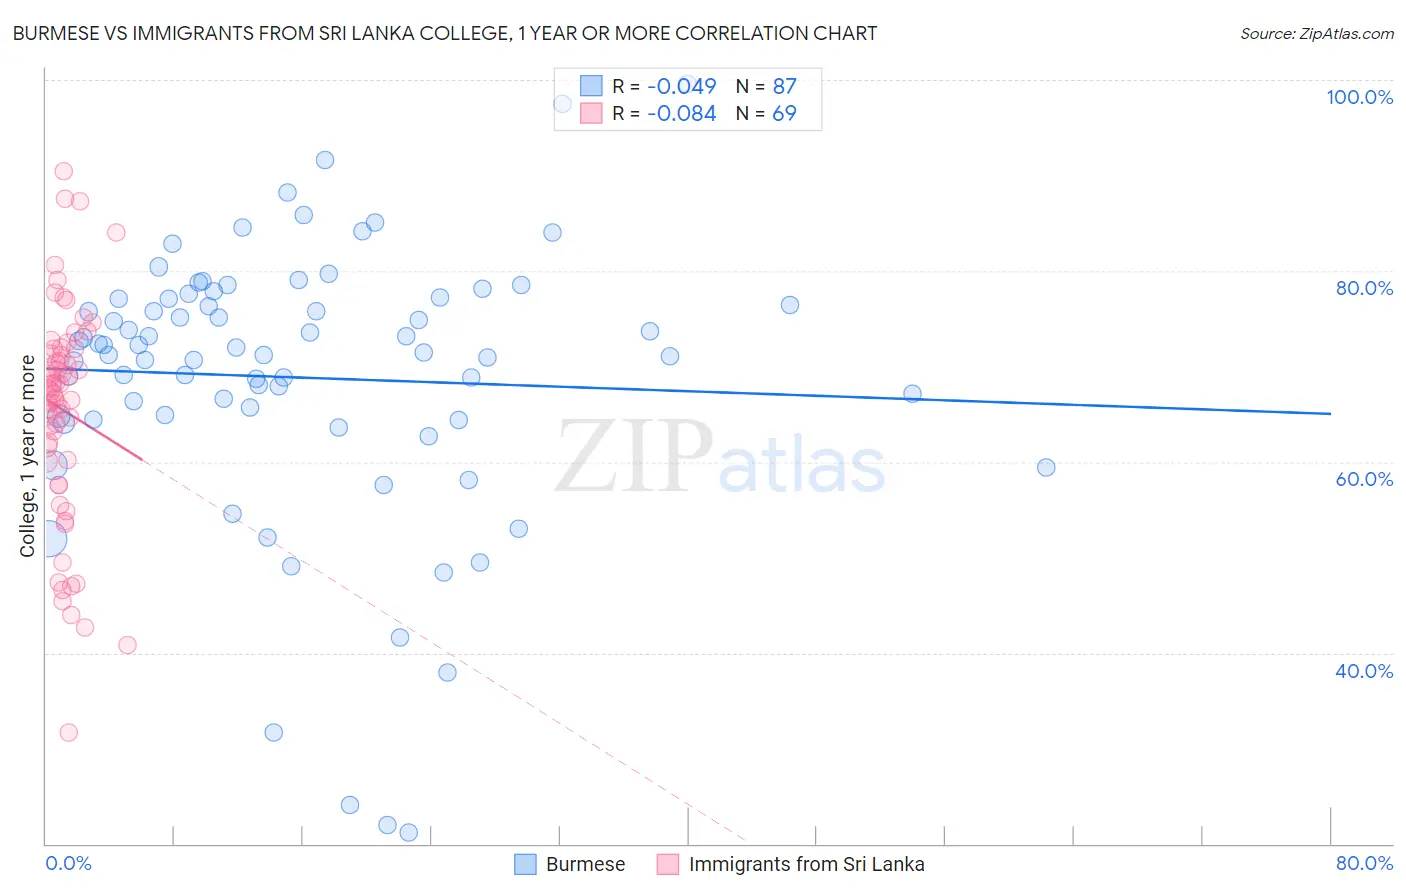
Burmese vs Immigrants from Sri Lanka College, 1 year or more Correlation Chart
The statistical analysis conducted on geographies consisting of 465,403,137 people shows no correlation between the proportion of Burmese and percentage of population with at least college, 1 year or more education in the United States with a correlation coefficient (R) of -0.049 and weighted average of 66.7%. Similarly, the statistical analysis conducted on geographies consisting of 149,700,552 people shows a slight negative correlation between the proportion of Immigrants from Sri Lanka and percentage of population with at least college, 1 year or more education in the United States with a correlation coefficient (R) of -0.084 and weighted average of 65.4%, a difference of 2.0%.
College, 1 year or more Correlation Summary
| Measurement | Burmese | Immigrants from Sri Lanka |
| Minimum | 21.2% | 31.7% |
| Maximum | 99.6% | 90.4% |
| Range | 78.4% | 58.7% |
| Mean | 68.8% | 65.4% |
| Median | 71.4% | 67.7% |
| Interquartile 25% (IQ1) | 64.5% | 60.1% |
| Interquartile 75% (IQ3) | 77.0% | 71.9% |
| Interquartile Range (IQR) | 12.6% | 11.8% |
| Standard Deviation (Sample) | 14.6% | 11.5% |
| Standard Deviation (Population) | 14.5% | 11.4% |
Demographics Similar to Burmese and Immigrants from Sri Lanka by College, 1 year or more
In terms of college, 1 year or more, the demographic groups most similar to Burmese are Cambodian (66.7%, a difference of 0.0%), Immigrants from Japan (66.7%, a difference of 0.040%), Immigrants from Eastern Asia (66.6%, a difference of 0.15%), Immigrants from Sweden (66.8%, a difference of 0.19%), and Eastern European (66.6%, a difference of 0.22%). Similarly, the demographic groups most similar to Immigrants from Sri Lanka are Bulgarian (65.5%, a difference of 0.15%), Turkish (65.5%, a difference of 0.20%), Immigrants from Denmark (65.6%, a difference of 0.28%), Immigrants from Northern Europe (65.6%, a difference of 0.39%), and Immigrants from France (65.8%, a difference of 0.64%).
| Demographics | Rating | Rank | College, 1 year or more |
| Immigrants | Sweden | 100.0 /100 | #13 | Exceptional 66.8% |
| Burmese | 100.0 /100 | #14 | Exceptional 66.7% |
| Cambodians | 100.0 /100 | #15 | Exceptional 66.7% |
| Immigrants | Japan | 100.0 /100 | #16 | Exceptional 66.7% |
| Immigrants | Eastern Asia | 100.0 /100 | #17 | Exceptional 66.6% |
| Eastern Europeans | 100.0 /100 | #18 | Exceptional 66.6% |
| Immigrants | Switzerland | 100.0 /100 | #19 | Exceptional 66.5% |
| Immigrants | Korea | 100.0 /100 | #20 | Exceptional 66.5% |
| Immigrants | Hong Kong | 100.0 /100 | #21 | Exceptional 66.4% |
| Soviet Union | 100.0 /100 | #22 | Exceptional 66.4% |
| Immigrants | China | 100.0 /100 | #23 | Exceptional 66.4% |
| Immigrants | Belgium | 100.0 /100 | #24 | Exceptional 66.3% |
| Indians (Asian) | 100.0 /100 | #25 | Exceptional 66.1% |
| Latvians | 100.0 /100 | #26 | Exceptional 66.1% |
| Immigrants | Ireland | 100.0 /100 | #27 | Exceptional 65.9% |
| Immigrants | France | 100.0 /100 | #28 | Exceptional 65.8% |
| Immigrants | Northern Europe | 100.0 /100 | #29 | Exceptional 65.6% |
| Immigrants | Denmark | 100.0 /100 | #30 | Exceptional 65.6% |
| Turks | 100.0 /100 | #31 | Exceptional 65.5% |
| Bulgarians | 100.0 /100 | #32 | Exceptional 65.5% |
| Immigrants | Sri Lanka | 99.9 /100 | #33 | Exceptional 65.4% |