Burmese vs Navajo College, 1 year or more
COMPARE
Burmese
Navajo
College, 1 year or more
College, 1 year or more Comparison
Burmese
Navajo
66.7%
COLLEGE, 1 YEAR OR MORE
100.0/ 100
METRIC RATING
14th/ 347
METRIC RANK
50.8%
COLLEGE, 1 YEAR OR MORE
0.0/ 100
METRIC RATING
322nd/ 347
METRIC RANK
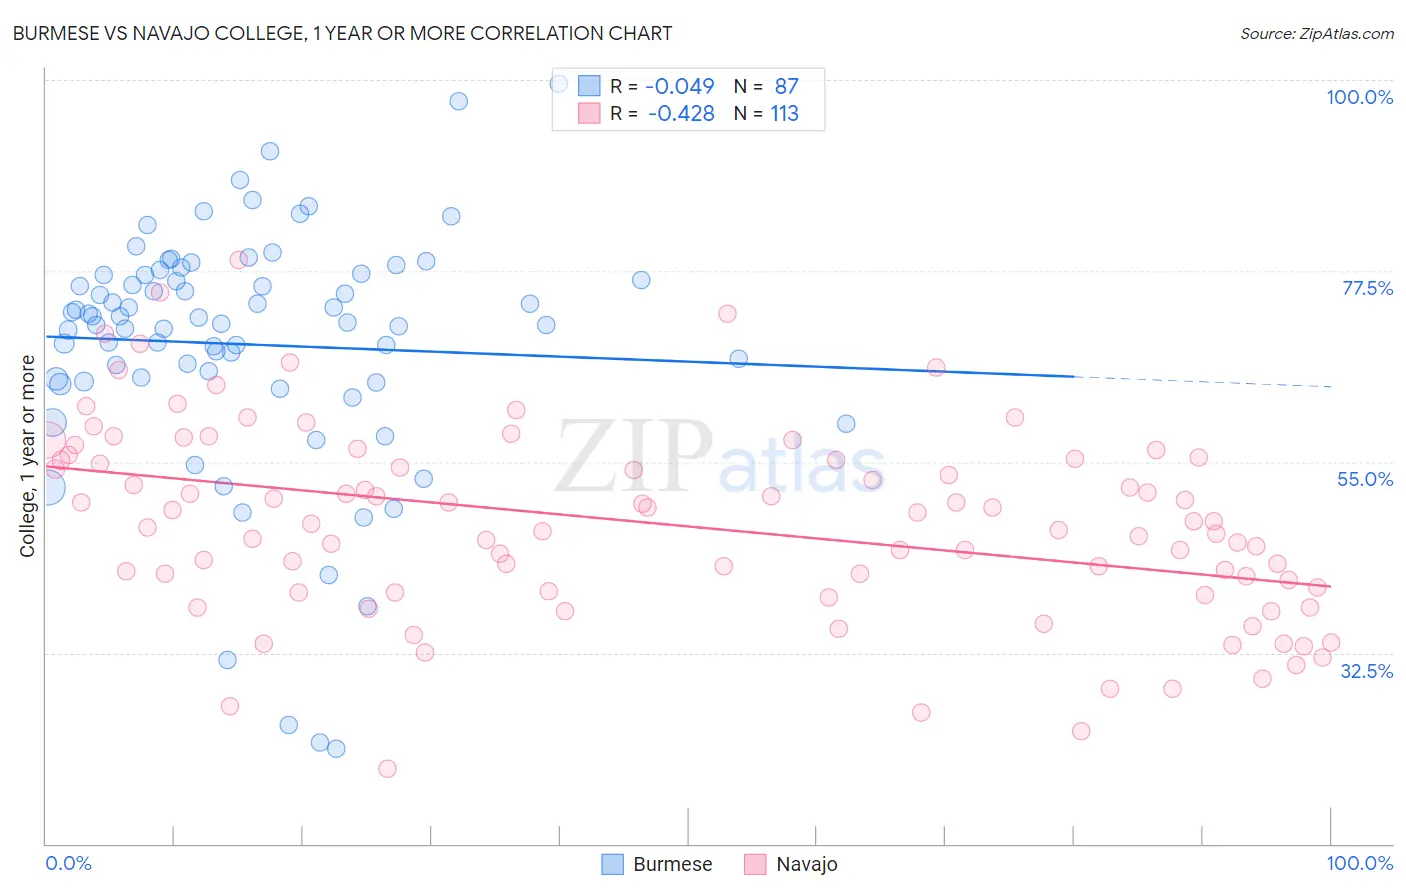
Burmese vs Navajo College, 1 year or more Correlation Chart
The statistical analysis conducted on geographies consisting of 465,403,137 people shows no correlation between the proportion of Burmese and percentage of population with at least college, 1 year or more education in the United States with a correlation coefficient (R) of -0.049 and weighted average of 66.7%. Similarly, the statistical analysis conducted on geographies consisting of 224,872,239 people shows a moderate negative correlation between the proportion of Navajo and percentage of population with at least college, 1 year or more education in the United States with a correlation coefficient (R) of -0.428 and weighted average of 50.8%, a difference of 31.3%.
College, 1 year or more Correlation Summary
| Measurement | Burmese | Navajo |
| Minimum | 21.2% | 18.9% |
| Maximum | 99.6% | 78.7% |
| Range | 78.4% | 59.8% |
| Mean | 68.8% | 47.6% |
| Median | 71.4% | 47.7% |
| Interquartile 25% (IQ1) | 64.5% | 39.7% |
| Interquartile 75% (IQ3) | 77.0% | 55.3% |
| Interquartile Range (IQR) | 12.6% | 15.6% |
| Standard Deviation (Sample) | 14.6% | 11.4% |
| Standard Deviation (Population) | 14.5% | 11.3% |
Similar Demographics by College, 1 year or more
Demographics Similar to Burmese by College, 1 year or more
In terms of college, 1 year or more, the demographic groups most similar to Burmese are Cambodian (66.7%, a difference of 0.0%), Immigrants from Japan (66.7%, a difference of 0.040%), Immigrants from Eastern Asia (66.6%, a difference of 0.15%), Immigrants from Sweden (66.8%, a difference of 0.19%), and Eastern European (66.6%, a difference of 0.22%).
| Demographics | Rating | Rank | College, 1 year or more |
| Okinawans | 100.0 /100 | #7 | Exceptional 69.0% |
| Thais | 100.0 /100 | #8 | Exceptional 68.6% |
| Immigrants | Israel | 100.0 /100 | #9 | Exceptional 67.8% |
| Immigrants | Australia | 100.0 /100 | #10 | Exceptional 67.7% |
| Immigrants | South Central Asia | 100.0 /100 | #11 | Exceptional 67.1% |
| Cypriots | 100.0 /100 | #12 | Exceptional 67.0% |
| Immigrants | Sweden | 100.0 /100 | #13 | Exceptional 66.8% |
| Burmese | 100.0 /100 | #14 | Exceptional 66.7% |
| Cambodians | 100.0 /100 | #15 | Exceptional 66.7% |
| Immigrants | Japan | 100.0 /100 | #16 | Exceptional 66.7% |
| Immigrants | Eastern Asia | 100.0 /100 | #17 | Exceptional 66.6% |
| Eastern Europeans | 100.0 /100 | #18 | Exceptional 66.6% |
| Immigrants | Switzerland | 100.0 /100 | #19 | Exceptional 66.5% |
| Immigrants | Korea | 100.0 /100 | #20 | Exceptional 66.5% |
| Immigrants | Hong Kong | 100.0 /100 | #21 | Exceptional 66.4% |
Demographics Similar to Navajo by College, 1 year or more
In terms of college, 1 year or more, the demographic groups most similar to Navajo are Hopi (50.9%, a difference of 0.18%), Immigrants from Guatemala (50.7%, a difference of 0.23%), Immigrants from Cuba (50.7%, a difference of 0.24%), Immigrants from Latin America (50.7%, a difference of 0.27%), and Kiowa (51.0%, a difference of 0.31%).
| Demographics | Rating | Rank | College, 1 year or more |
| Guatemalans | 0.0 /100 | #315 | Tragic 51.2% |
| Cajuns | 0.0 /100 | #316 | Tragic 51.2% |
| Hispanics or Latinos | 0.0 /100 | #317 | Tragic 51.1% |
| Immigrants | Honduras | 0.0 /100 | #318 | Tragic 51.0% |
| Immigrants | El Salvador | 0.0 /100 | #319 | Tragic 51.0% |
| Kiowa | 0.0 /100 | #320 | Tragic 51.0% |
| Hopi | 0.0 /100 | #321 | Tragic 50.9% |
| Navajo | 0.0 /100 | #322 | Tragic 50.8% |
| Immigrants | Guatemala | 0.0 /100 | #323 | Tragic 50.7% |
| Immigrants | Cuba | 0.0 /100 | #324 | Tragic 50.7% |
| Immigrants | Latin America | 0.0 /100 | #325 | Tragic 50.7% |
| Dominicans | 0.0 /100 | #326 | Tragic 50.6% |
| Menominee | 0.0 /100 | #327 | Tragic 50.6% |
| Dutch West Indians | 0.0 /100 | #328 | Tragic 50.5% |
| Cape Verdeans | 0.0 /100 | #329 | Tragic 50.3% |