Brazilian vs Latvian GED/Equivalency
COMPARE
Brazilian
Latvian
GED/Equivalency
GED/Equivalency Comparison
Brazilians
Latvians
86.3%
GED/EQUIVALENCY
77.2/ 100
METRIC RATING
152nd/ 347
METRIC RANK
89.2%
GED/EQUIVALENCY
100.0/ 100
METRIC RATING
5th/ 347
METRIC RANK
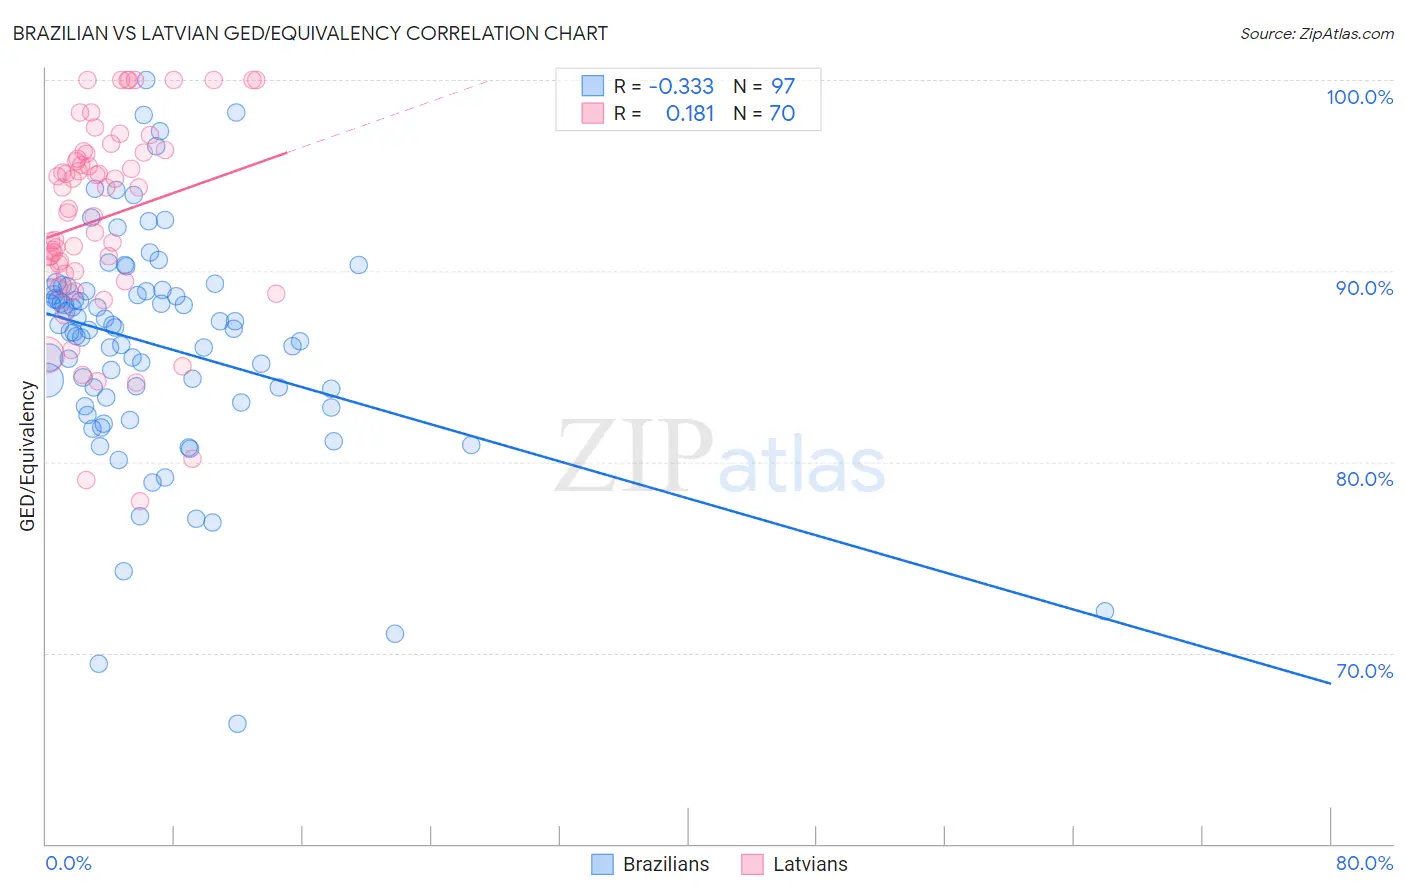
Brazilian vs Latvian GED/Equivalency Correlation Chart
The statistical analysis conducted on geographies consisting of 323,949,291 people shows a mild negative correlation between the proportion of Brazilians and percentage of population with at least ged/equivalency education in the United States with a correlation coefficient (R) of -0.333 and weighted average of 86.3%. Similarly, the statistical analysis conducted on geographies consisting of 220,726,693 people shows a poor positive correlation between the proportion of Latvians and percentage of population with at least ged/equivalency education in the United States with a correlation coefficient (R) of 0.181 and weighted average of 89.2%, a difference of 3.3%.
GED/Equivalency Correlation Summary
| Measurement | Brazilian | Latvian |
| Minimum | 66.3% | 78.0% |
| Maximum | 100.0% | 100.0% |
| Range | 33.7% | 22.0% |
| Mean | 86.1% | 92.8% |
| Median | 87.0% | 93.8% |
| Interquartile 25% (IQ1) | 83.3% | 90.0% |
| Interquartile 75% (IQ3) | 89.0% | 96.2% |
| Interquartile Range (IQR) | 5.7% | 6.2% |
| Standard Deviation (Sample) | 5.8% | 5.2% |
| Standard Deviation (Population) | 5.8% | 5.2% |
Similar Demographics by GED/Equivalency
Demographics Similar to Brazilians by GED/Equivalency
In terms of ged/equivalency, the demographic groups most similar to Brazilians are Immigrants from Bosnia and Herzegovina (86.3%, a difference of 0.020%), Kenyan (86.3%, a difference of 0.020%), Armenian (86.3%, a difference of 0.020%), Immigrants from Western Asia (86.3%, a difference of 0.050%), and Immigrants from Poland (86.3%, a difference of 0.060%).
| Demographics | Rating | Rank | GED/Equivalency |
| Pakistanis | 80.4 /100 | #145 | Excellent 86.4% |
| Basques | 79.5 /100 | #146 | Good 86.4% |
| Immigrants | Northern Africa | 79.3 /100 | #147 | Good 86.3% |
| Immigrants | Poland | 79.3 /100 | #148 | Good 86.3% |
| Menominee | 79.3 /100 | #149 | Good 86.3% |
| Immigrants | Western Asia | 78.8 /100 | #150 | Good 86.3% |
| Immigrants | Bosnia and Herzegovina | 77.9 /100 | #151 | Good 86.3% |
| Brazilians | 77.2 /100 | #152 | Good 86.3% |
| Kenyans | 76.6 /100 | #153 | Good 86.3% |
| Armenians | 76.4 /100 | #154 | Good 86.3% |
| Iraqis | 75.2 /100 | #155 | Good 86.2% |
| Immigrants | Nepal | 73.3 /100 | #156 | Good 86.2% |
| Whites/Caucasians | 72.2 /100 | #157 | Good 86.2% |
| German Russians | 72.1 /100 | #158 | Good 86.2% |
| Immigrants | Kenya | 71.8 /100 | #159 | Good 86.2% |
Demographics Similar to Latvians by GED/Equivalency
In terms of ged/equivalency, the demographic groups most similar to Latvians are Thai (89.1%, a difference of 0.020%), Eastern European (89.1%, a difference of 0.060%), Iranian (89.2%, a difference of 0.10%), Carpatho Rusyn (89.1%, a difference of 0.11%), and Chinese (89.0%, a difference of 0.13%).
| Demographics | Rating | Rank | GED/Equivalency |
| Immigrants | India | 100.0 /100 | #1 | Exceptional 89.7% |
| Filipinos | 100.0 /100 | #2 | Exceptional 89.5% |
| Immigrants | Singapore | 100.0 /100 | #3 | Exceptional 89.3% |
| Iranians | 100.0 /100 | #4 | Exceptional 89.2% |
| Latvians | 100.0 /100 | #5 | Exceptional 89.2% |
| Thais | 100.0 /100 | #6 | Exceptional 89.1% |
| Eastern Europeans | 99.9 /100 | #7 | Exceptional 89.1% |
| Carpatho Rusyns | 99.9 /100 | #8 | Exceptional 89.1% |
| Chinese | 99.9 /100 | #9 | Exceptional 89.0% |
| Norwegians | 99.9 /100 | #10 | Exceptional 89.0% |
| Bulgarians | 99.9 /100 | #11 | Exceptional 89.0% |
| Lithuanians | 99.9 /100 | #12 | Exceptional 88.9% |
| Immigrants | Iran | 99.9 /100 | #13 | Exceptional 88.9% |
| Cypriots | 99.9 /100 | #14 | Exceptional 88.9% |
| Okinawans | 99.9 /100 | #15 | Exceptional 88.9% |