Brazilian vs Immigrants from Northern Europe GED/Equivalency
COMPARE
Brazilian
Immigrants from Northern Europe
GED/Equivalency
GED/Equivalency Comparison
Brazilians
Immigrants from Northern Europe
86.3%
GED/EQUIVALENCY
77.2/ 100
METRIC RATING
152nd/ 347
METRIC RANK
88.5%
GED/EQUIVALENCY
99.8/ 100
METRIC RATING
28th/ 347
METRIC RANK
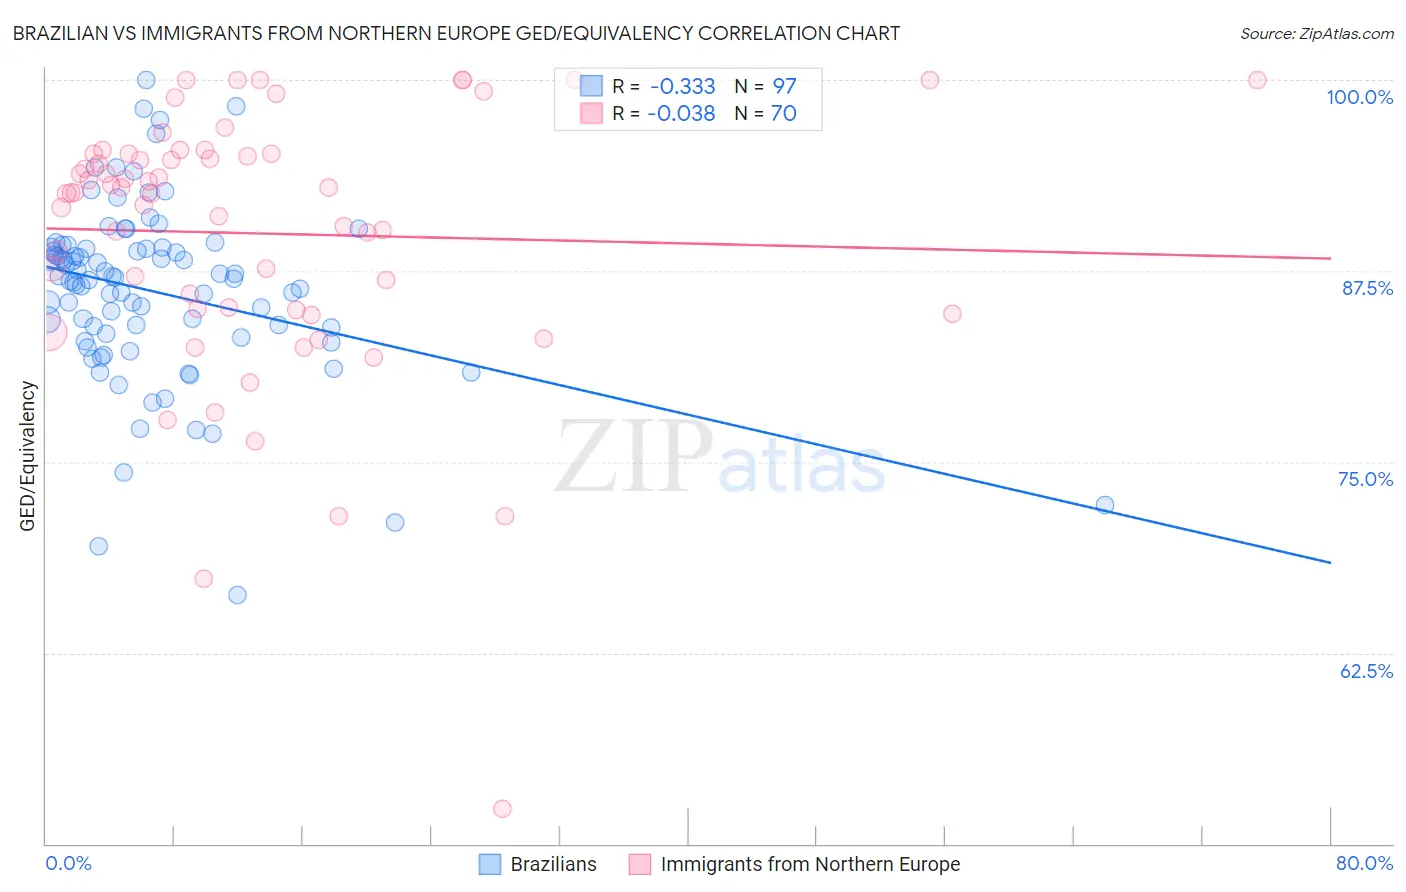
Brazilian vs Immigrants from Northern Europe GED/Equivalency Correlation Chart
The statistical analysis conducted on geographies consisting of 323,949,291 people shows a mild negative correlation between the proportion of Brazilians and percentage of population with at least ged/equivalency education in the United States with a correlation coefficient (R) of -0.333 and weighted average of 86.3%. Similarly, the statistical analysis conducted on geographies consisting of 477,226,871 people shows no correlation between the proportion of Immigrants from Northern Europe and percentage of population with at least ged/equivalency education in the United States with a correlation coefficient (R) of -0.038 and weighted average of 88.5%, a difference of 2.6%.
GED/Equivalency Correlation Summary
| Measurement | Brazilian | Immigrants from Northern Europe |
| Minimum | 66.3% | 52.3% |
| Maximum | 100.0% | 100.0% |
| Range | 33.7% | 47.7% |
| Mean | 86.1% | 90.0% |
| Median | 87.0% | 92.6% |
| Interquartile 25% (IQ1) | 83.3% | 85.1% |
| Interquartile 75% (IQ3) | 89.0% | 95.2% |
| Interquartile Range (IQR) | 5.7% | 10.2% |
| Standard Deviation (Sample) | 5.8% | 8.7% |
| Standard Deviation (Population) | 5.8% | 8.7% |
Similar Demographics by GED/Equivalency
Demographics Similar to Brazilians by GED/Equivalency
In terms of ged/equivalency, the demographic groups most similar to Brazilians are Immigrants from Bosnia and Herzegovina (86.3%, a difference of 0.020%), Kenyan (86.3%, a difference of 0.020%), Armenian (86.3%, a difference of 0.020%), Immigrants from Western Asia (86.3%, a difference of 0.050%), and Immigrants from Poland (86.3%, a difference of 0.060%).
| Demographics | Rating | Rank | GED/Equivalency |
| Pakistanis | 80.4 /100 | #145 | Excellent 86.4% |
| Basques | 79.5 /100 | #146 | Good 86.4% |
| Immigrants | Northern Africa | 79.3 /100 | #147 | Good 86.3% |
| Immigrants | Poland | 79.3 /100 | #148 | Good 86.3% |
| Menominee | 79.3 /100 | #149 | Good 86.3% |
| Immigrants | Western Asia | 78.8 /100 | #150 | Good 86.3% |
| Immigrants | Bosnia and Herzegovina | 77.9 /100 | #151 | Good 86.3% |
| Brazilians | 77.2 /100 | #152 | Good 86.3% |
| Kenyans | 76.6 /100 | #153 | Good 86.3% |
| Armenians | 76.4 /100 | #154 | Good 86.3% |
| Iraqis | 75.2 /100 | #155 | Good 86.2% |
| Immigrants | Nepal | 73.3 /100 | #156 | Good 86.2% |
| Whites/Caucasians | 72.2 /100 | #157 | Good 86.2% |
| German Russians | 72.1 /100 | #158 | Good 86.2% |
| Immigrants | Kenya | 71.8 /100 | #159 | Good 86.2% |
Demographics Similar to Immigrants from Northern Europe by GED/Equivalency
In terms of ged/equivalency, the demographic groups most similar to Immigrants from Northern Europe are Polish (88.5%, a difference of 0.030%), Immigrants from Lithuania (88.6%, a difference of 0.040%), Turkish (88.5%, a difference of 0.050%), Russian (88.6%, a difference of 0.080%), and Slovak (88.6%, a difference of 0.080%).
| Demographics | Rating | Rank | GED/Equivalency |
| Luxembourgers | 99.8 /100 | #21 | Exceptional 88.6% |
| Immigrants | Ireland | 99.8 /100 | #22 | Exceptional 88.6% |
| Russians | 99.8 /100 | #23 | Exceptional 88.6% |
| Slovaks | 99.8 /100 | #24 | Exceptional 88.6% |
| Estonians | 99.8 /100 | #25 | Exceptional 88.6% |
| Immigrants | Australia | 99.8 /100 | #26 | Exceptional 88.6% |
| Immigrants | Lithuania | 99.8 /100 | #27 | Exceptional 88.6% |
| Immigrants | Northern Europe | 99.8 /100 | #28 | Exceptional 88.5% |
| Poles | 99.8 /100 | #29 | Exceptional 88.5% |
| Turks | 99.8 /100 | #30 | Exceptional 88.5% |
| Bhutanese | 99.8 /100 | #31 | Exceptional 88.4% |
| Danes | 99.8 /100 | #32 | Exceptional 88.4% |
| Immigrants | Sweden | 99.7 /100 | #33 | Exceptional 88.4% |
| Immigrants | Japan | 99.7 /100 | #34 | Exceptional 88.4% |
| Immigrants | South Central Asia | 99.7 /100 | #35 | Exceptional 88.4% |