Okinawan vs Latvian GED/Equivalency
COMPARE
Okinawan
Latvian
GED/Equivalency
GED/Equivalency Comparison
Okinawans
Latvians
88.9%
GED/EQUIVALENCY
99.9/ 100
METRIC RATING
15th/ 347
METRIC RANK
89.2%
GED/EQUIVALENCY
100.0/ 100
METRIC RATING
5th/ 347
METRIC RANK
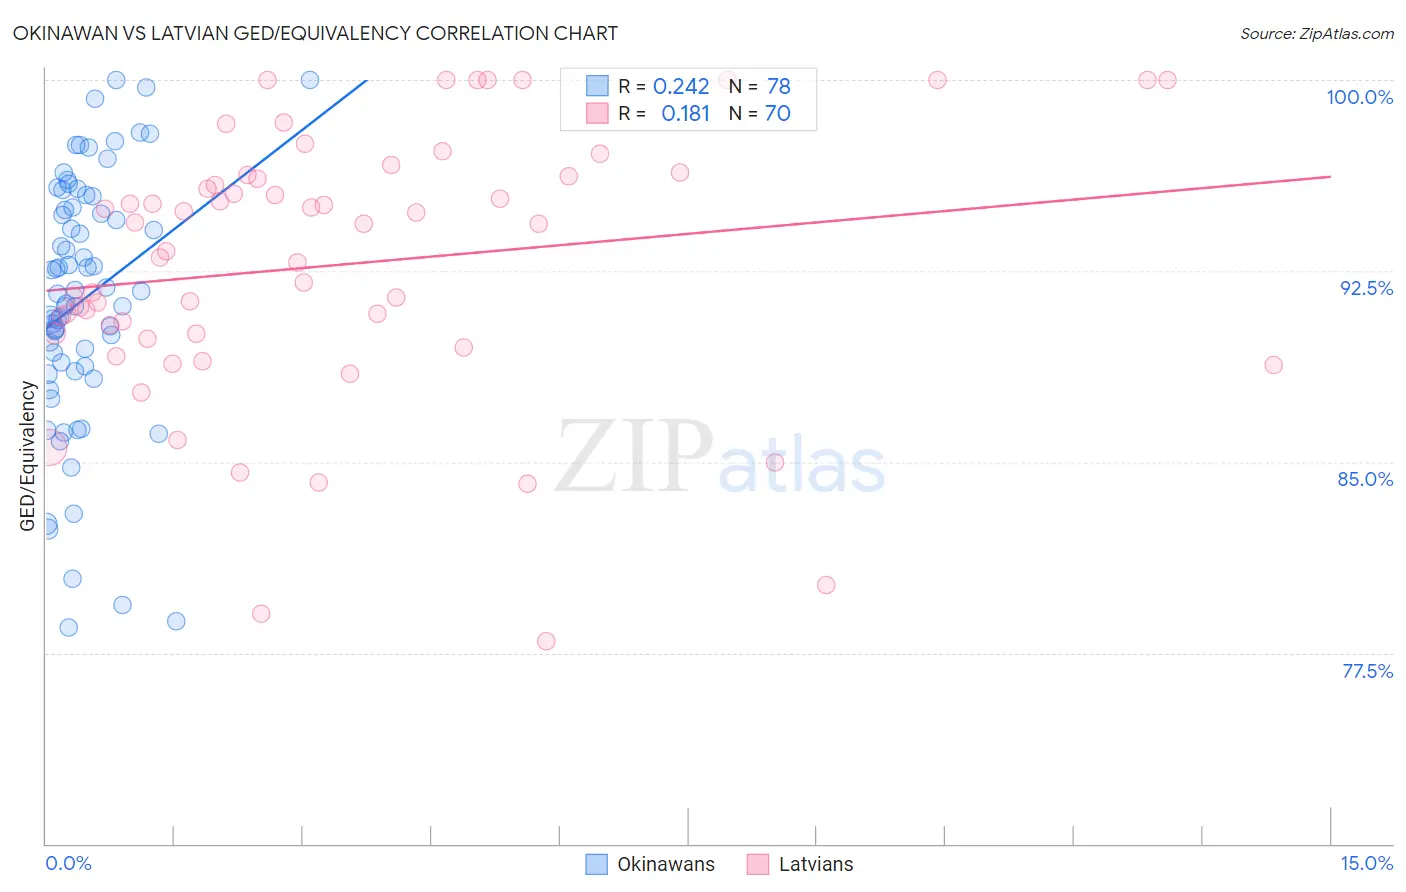
Okinawan vs Latvian GED/Equivalency Correlation Chart
The statistical analysis conducted on geographies consisting of 73,775,797 people shows a weak positive correlation between the proportion of Okinawans and percentage of population with at least ged/equivalency education in the United States with a correlation coefficient (R) of 0.242 and weighted average of 88.9%. Similarly, the statistical analysis conducted on geographies consisting of 220,726,693 people shows a poor positive correlation between the proportion of Latvians and percentage of population with at least ged/equivalency education in the United States with a correlation coefficient (R) of 0.181 and weighted average of 89.2%, a difference of 0.31%.
GED/Equivalency Correlation Summary
| Measurement | Okinawan | Latvian |
| Minimum | 78.5% | 78.0% |
| Maximum | 100.0% | 100.0% |
| Range | 21.5% | 22.0% |
| Mean | 91.4% | 92.8% |
| Median | 91.7% | 93.8% |
| Interquartile 25% (IQ1) | 88.8% | 90.0% |
| Interquartile 75% (IQ3) | 95.0% | 96.2% |
| Interquartile Range (IQR) | 6.2% | 6.2% |
| Standard Deviation (Sample) | 5.0% | 5.2% |
| Standard Deviation (Population) | 5.0% | 5.2% |
Demographics Similar to Okinawans and Latvians by GED/Equivalency
In terms of ged/equivalency, the demographic groups most similar to Okinawans are Cypriot (88.9%, a difference of 0.020%), Immigrants from Taiwan (88.8%, a difference of 0.030%), Lithuanian (88.9%, a difference of 0.050%), Immigrants from Iran (88.9%, a difference of 0.050%), and Croatian (88.8%, a difference of 0.060%). Similarly, the demographic groups most similar to Latvians are Thai (89.1%, a difference of 0.020%), Eastern European (89.1%, a difference of 0.060%), Iranian (89.2%, a difference of 0.10%), Carpatho Rusyn (89.1%, a difference of 0.11%), and Chinese (89.0%, a difference of 0.13%).
| Demographics | Rating | Rank | GED/Equivalency |
| Immigrants | India | 100.0 /100 | #1 | Exceptional 89.7% |
| Filipinos | 100.0 /100 | #2 | Exceptional 89.5% |
| Immigrants | Singapore | 100.0 /100 | #3 | Exceptional 89.3% |
| Iranians | 100.0 /100 | #4 | Exceptional 89.2% |
| Latvians | 100.0 /100 | #5 | Exceptional 89.2% |
| Thais | 100.0 /100 | #6 | Exceptional 89.1% |
| Eastern Europeans | 99.9 /100 | #7 | Exceptional 89.1% |
| Carpatho Rusyns | 99.9 /100 | #8 | Exceptional 89.1% |
| Chinese | 99.9 /100 | #9 | Exceptional 89.0% |
| Norwegians | 99.9 /100 | #10 | Exceptional 89.0% |
| Bulgarians | 99.9 /100 | #11 | Exceptional 89.0% |
| Lithuanians | 99.9 /100 | #12 | Exceptional 88.9% |
| Immigrants | Iran | 99.9 /100 | #13 | Exceptional 88.9% |
| Cypriots | 99.9 /100 | #14 | Exceptional 88.9% |
| Okinawans | 99.9 /100 | #15 | Exceptional 88.9% |
| Immigrants | Taiwan | 99.9 /100 | #16 | Exceptional 88.8% |
| Croatians | 99.9 /100 | #17 | Exceptional 88.8% |
| Slovenes | 99.9 /100 | #18 | Exceptional 88.8% |
| Swedes | 99.9 /100 | #19 | Exceptional 88.8% |
| Maltese | 99.9 /100 | #20 | Exceptional 88.6% |