Brazilian vs Latvian Hearing Disability
COMPARE
Brazilian
Latvian
Hearing Disability
Hearing Disability Comparison
Brazilians
Latvians
2.9%
HEARING DISABILITY
78.7/ 100
METRIC RATING
146th/ 347
METRIC RANK
3.2%
HEARING DISABILITY
5.1/ 100
METRIC RATING
225th/ 347
METRIC RANK
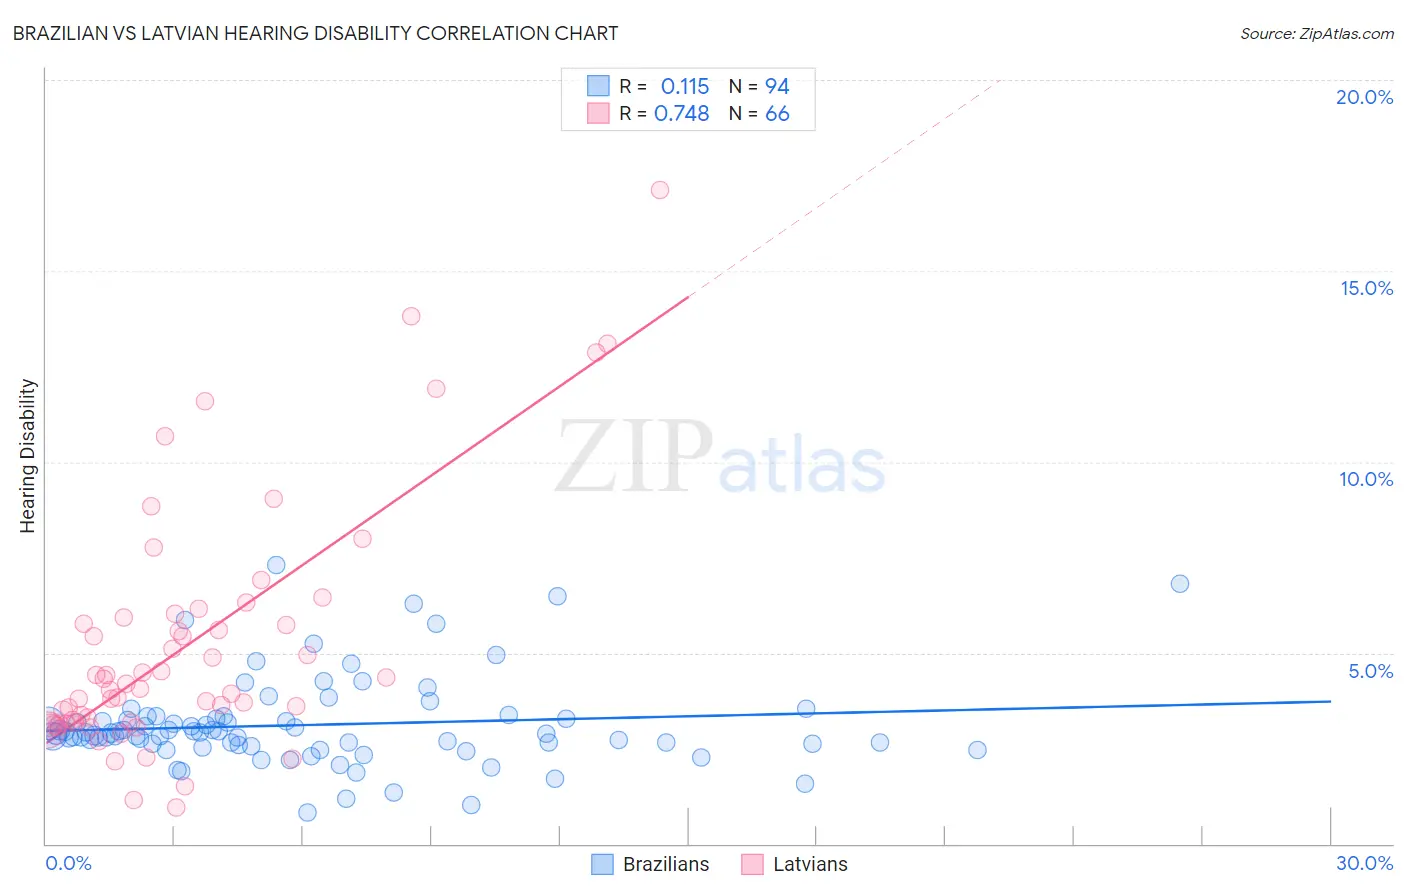
Brazilian vs Latvian Hearing Disability Correlation Chart
The statistical analysis conducted on geographies consisting of 323,867,149 people shows a poor positive correlation between the proportion of Brazilians and percentage of population with hearing disability in the United States with a correlation coefficient (R) of 0.115 and weighted average of 2.9%. Similarly, the statistical analysis conducted on geographies consisting of 220,695,390 people shows a strong positive correlation between the proportion of Latvians and percentage of population with hearing disability in the United States with a correlation coefficient (R) of 0.748 and weighted average of 3.2%, a difference of 10.2%.
Hearing Disability Correlation Summary
| Measurement | Brazilian | Latvian |
| Minimum | 0.82% | 0.95% |
| Maximum | 7.3% | 17.1% |
| Range | 6.5% | 16.2% |
| Mean | 3.1% | 5.2% |
| Median | 2.9% | 4.1% |
| Interquartile 25% (IQ1) | 2.6% | 3.2% |
| Interquartile 75% (IQ3) | 3.3% | 5.9% |
| Interquartile Range (IQR) | 0.65% | 2.8% |
| Standard Deviation (Sample) | 1.2% | 3.2% |
| Standard Deviation (Population) | 1.2% | 3.2% |
Similar Demographics by Hearing Disability
Demographics Similar to Brazilians by Hearing Disability
In terms of hearing disability, the demographic groups most similar to Brazilians are Tongan (2.9%, a difference of 0.010%), Immigrants from Congo (2.9%, a difference of 0.020%), Immigrants from Bulgaria (2.9%, a difference of 0.070%), Immigrants from Russia (2.9%, a difference of 0.15%), and Immigrants from Panama (2.9%, a difference of 0.26%).
| Demographics | Rating | Rank | Hearing Disability |
| Bermudans | 83.8 /100 | #139 | Excellent 2.9% |
| Immigrants | Jordan | 83.7 /100 | #140 | Excellent 2.9% |
| Sub-Saharan Africans | 83.3 /100 | #141 | Excellent 2.9% |
| Laotians | 81.1 /100 | #142 | Excellent 2.9% |
| Immigrants | Bahamas | 80.9 /100 | #143 | Excellent 2.9% |
| Immigrants | Bulgaria | 79.2 /100 | #144 | Good 2.9% |
| Immigrants | Congo | 78.9 /100 | #145 | Good 2.9% |
| Brazilians | 78.7 /100 | #146 | Good 2.9% |
| Tongans | 78.6 /100 | #147 | Good 2.9% |
| Immigrants | Russia | 77.7 /100 | #148 | Good 2.9% |
| Immigrants | Panama | 76.9 /100 | #149 | Good 2.9% |
| Palestinians | 73.6 /100 | #150 | Good 2.9% |
| Immigrants | France | 73.1 /100 | #151 | Good 2.9% |
| Immigrants | Lithuania | 73.0 /100 | #152 | Good 2.9% |
| Sudanese | 72.1 /100 | #153 | Good 2.9% |
Demographics Similar to Latvians by Hearing Disability
In terms of hearing disability, the demographic groups most similar to Latvians are Icelander (3.2%, a difference of 0.040%), Lebanese (3.2%, a difference of 0.040%), Mexican (3.2%, a difference of 0.21%), Bhutanese (3.2%, a difference of 0.23%), and Immigrants from Portugal (3.2%, a difference of 0.42%).
| Demographics | Rating | Rank | Hearing Disability |
| Immigrants | Northern Europe | 7.0 /100 | #218 | Tragic 3.2% |
| New Zealanders | 6.8 /100 | #219 | Tragic 3.2% |
| Malaysians | 6.6 /100 | #220 | Tragic 3.2% |
| Immigrants | Laos | 6.6 /100 | #221 | Tragic 3.2% |
| Immigrants | Oceania | 6.5 /100 | #222 | Tragic 3.2% |
| Mexicans | 5.6 /100 | #223 | Tragic 3.2% |
| Icelanders | 5.2 /100 | #224 | Tragic 3.2% |
| Latvians | 5.1 /100 | #225 | Tragic 3.2% |
| Lebanese | 5.0 /100 | #226 | Tragic 3.2% |
| Bhutanese | 4.6 /100 | #227 | Tragic 3.2% |
| Immigrants | Portugal | 4.3 /100 | #228 | Tragic 3.2% |
| Maltese | 4.1 /100 | #229 | Tragic 3.2% |
| Greeks | 3.2 /100 | #230 | Tragic 3.2% |
| Luxembourgers | 2.9 /100 | #231 | Tragic 3.2% |
| Ukrainians | 2.9 /100 | #232 | Tragic 3.2% |