Tohono O'odham vs Latvian GED/Equivalency
COMPARE
Tohono O'odham
Latvian
GED/Equivalency
GED/Equivalency Comparison
Tohono O'odham
Latvians
77.5%
GED/EQUIVALENCY
0.0/ 100
METRIC RATING
340th/ 347
METRIC RANK
89.2%
GED/EQUIVALENCY
100.0/ 100
METRIC RATING
5th/ 347
METRIC RANK
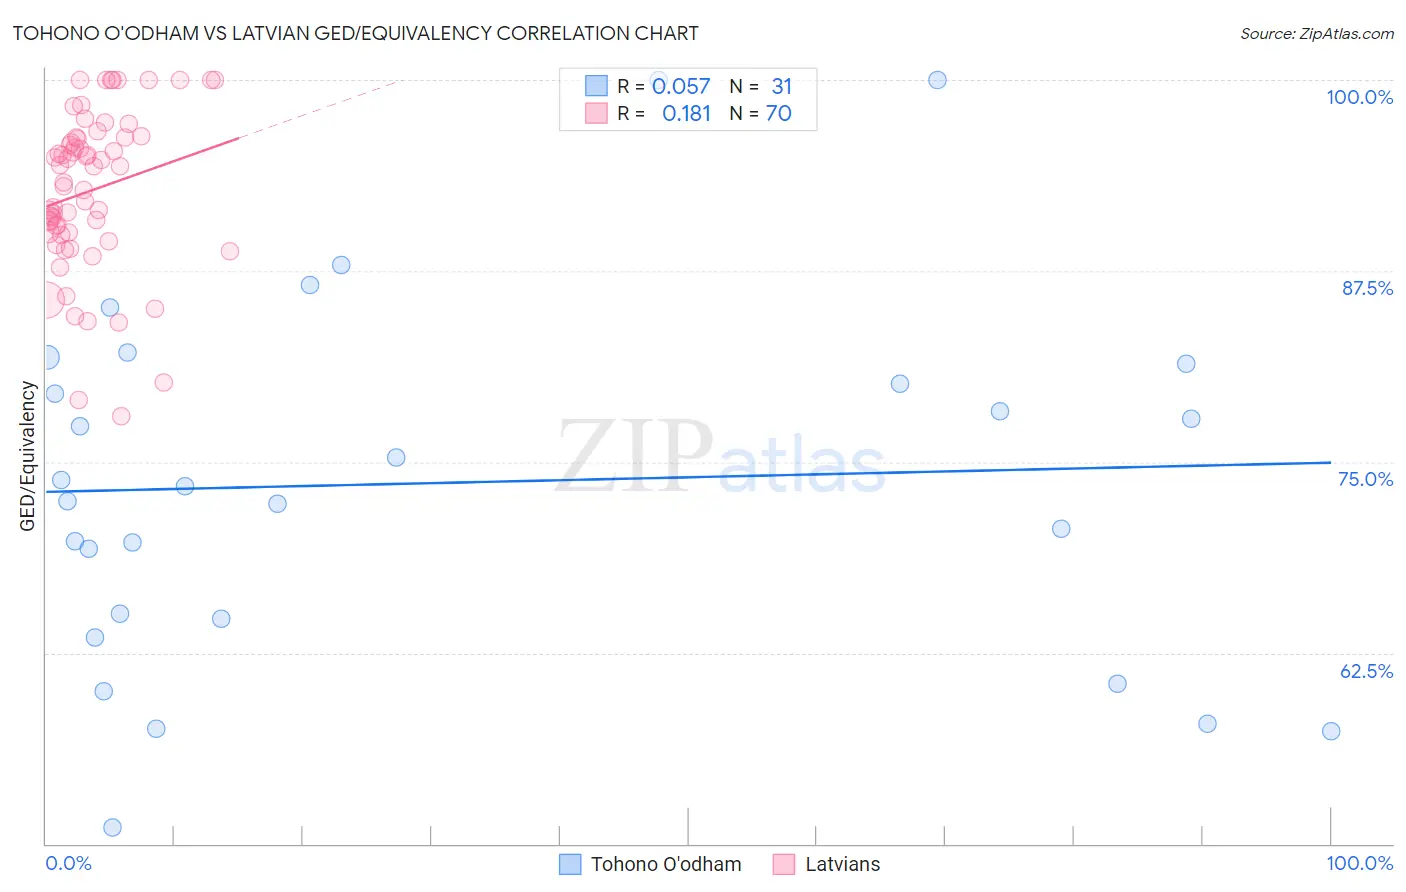
Tohono O'odham vs Latvian GED/Equivalency Correlation Chart
The statistical analysis conducted on geographies consisting of 58,730,525 people shows a slight positive correlation between the proportion of Tohono O'odham and percentage of population with at least ged/equivalency education in the United States with a correlation coefficient (R) of 0.057 and weighted average of 77.5%. Similarly, the statistical analysis conducted on geographies consisting of 220,726,693 people shows a poor positive correlation between the proportion of Latvians and percentage of population with at least ged/equivalency education in the United States with a correlation coefficient (R) of 0.181 and weighted average of 89.2%, a difference of 15.0%.
GED/Equivalency Correlation Summary
| Measurement | Tohono O'odham | Latvian |
| Minimum | 51.1% | 78.0% |
| Maximum | 100.0% | 100.0% |
| Range | 48.9% | 22.0% |
| Mean | 73.6% | 92.8% |
| Median | 73.4% | 93.8% |
| Interquartile 25% (IQ1) | 64.7% | 90.0% |
| Interquartile 75% (IQ3) | 81.4% | 96.2% |
| Interquartile Range (IQR) | 16.7% | 6.2% |
| Standard Deviation (Sample) | 11.8% | 5.2% |
| Standard Deviation (Population) | 11.6% | 5.2% |
Similar Demographics by GED/Equivalency
Demographics Similar to Tohono O'odham by GED/Equivalency
In terms of ged/equivalency, the demographic groups most similar to Tohono O'odham are Mexican (77.4%, a difference of 0.090%), Immigrants from El Salvador (77.6%, a difference of 0.16%), Immigrants from Guatemala (77.9%, a difference of 0.54%), Immigrants from Yemen (77.9%, a difference of 0.56%), and Immigrants from Dominican Republic (78.0%, a difference of 0.63%).
| Demographics | Rating | Rank | GED/Equivalency |
| Salvadorans | 0.0 /100 | #333 | Tragic 78.6% |
| Guatemalans | 0.0 /100 | #334 | Tragic 78.5% |
| Immigrants | Latin America | 0.0 /100 | #335 | Tragic 78.5% |
| Immigrants | Dominican Republic | 0.0 /100 | #336 | Tragic 78.0% |
| Immigrants | Yemen | 0.0 /100 | #337 | Tragic 77.9% |
| Immigrants | Guatemala | 0.0 /100 | #338 | Tragic 77.9% |
| Immigrants | El Salvador | 0.0 /100 | #339 | Tragic 77.6% |
| Tohono O'odham | 0.0 /100 | #340 | Tragic 77.5% |
| Mexicans | 0.0 /100 | #341 | Tragic 77.4% |
| Pima | 0.0 /100 | #342 | Tragic 76.4% |
| Immigrants | Central America | 0.0 /100 | #343 | Tragic 76.4% |
| Spanish American Indians | 0.0 /100 | #344 | Tragic 76.3% |
| Immigrants | Mexico | 0.0 /100 | #345 | Tragic 75.7% |
| Houma | 0.0 /100 | #346 | Tragic 75.0% |
| Yakama | 0.0 /100 | #347 | Tragic 74.5% |
Demographics Similar to Latvians by GED/Equivalency
In terms of ged/equivalency, the demographic groups most similar to Latvians are Thai (89.1%, a difference of 0.020%), Eastern European (89.1%, a difference of 0.060%), Iranian (89.2%, a difference of 0.10%), Carpatho Rusyn (89.1%, a difference of 0.11%), and Chinese (89.0%, a difference of 0.13%).
| Demographics | Rating | Rank | GED/Equivalency |
| Immigrants | India | 100.0 /100 | #1 | Exceptional 89.7% |
| Filipinos | 100.0 /100 | #2 | Exceptional 89.5% |
| Immigrants | Singapore | 100.0 /100 | #3 | Exceptional 89.3% |
| Iranians | 100.0 /100 | #4 | Exceptional 89.2% |
| Latvians | 100.0 /100 | #5 | Exceptional 89.2% |
| Thais | 100.0 /100 | #6 | Exceptional 89.1% |
| Eastern Europeans | 99.9 /100 | #7 | Exceptional 89.1% |
| Carpatho Rusyns | 99.9 /100 | #8 | Exceptional 89.1% |
| Chinese | 99.9 /100 | #9 | Exceptional 89.0% |
| Norwegians | 99.9 /100 | #10 | Exceptional 89.0% |
| Bulgarians | 99.9 /100 | #11 | Exceptional 89.0% |
| Lithuanians | 99.9 /100 | #12 | Exceptional 88.9% |
| Immigrants | Iran | 99.9 /100 | #13 | Exceptional 88.9% |
| Cypriots | 99.9 /100 | #14 | Exceptional 88.9% |
| Okinawans | 99.9 /100 | #15 | Exceptional 88.9% |