Guatemalan vs Latvian GED/Equivalency
COMPARE
Guatemalan
Latvian
GED/Equivalency
GED/Equivalency Comparison
Guatemalans
Latvians
78.5%
GED/EQUIVALENCY
0.0/ 100
METRIC RATING
334th/ 347
METRIC RANK
89.2%
GED/EQUIVALENCY
100.0/ 100
METRIC RATING
5th/ 347
METRIC RANK
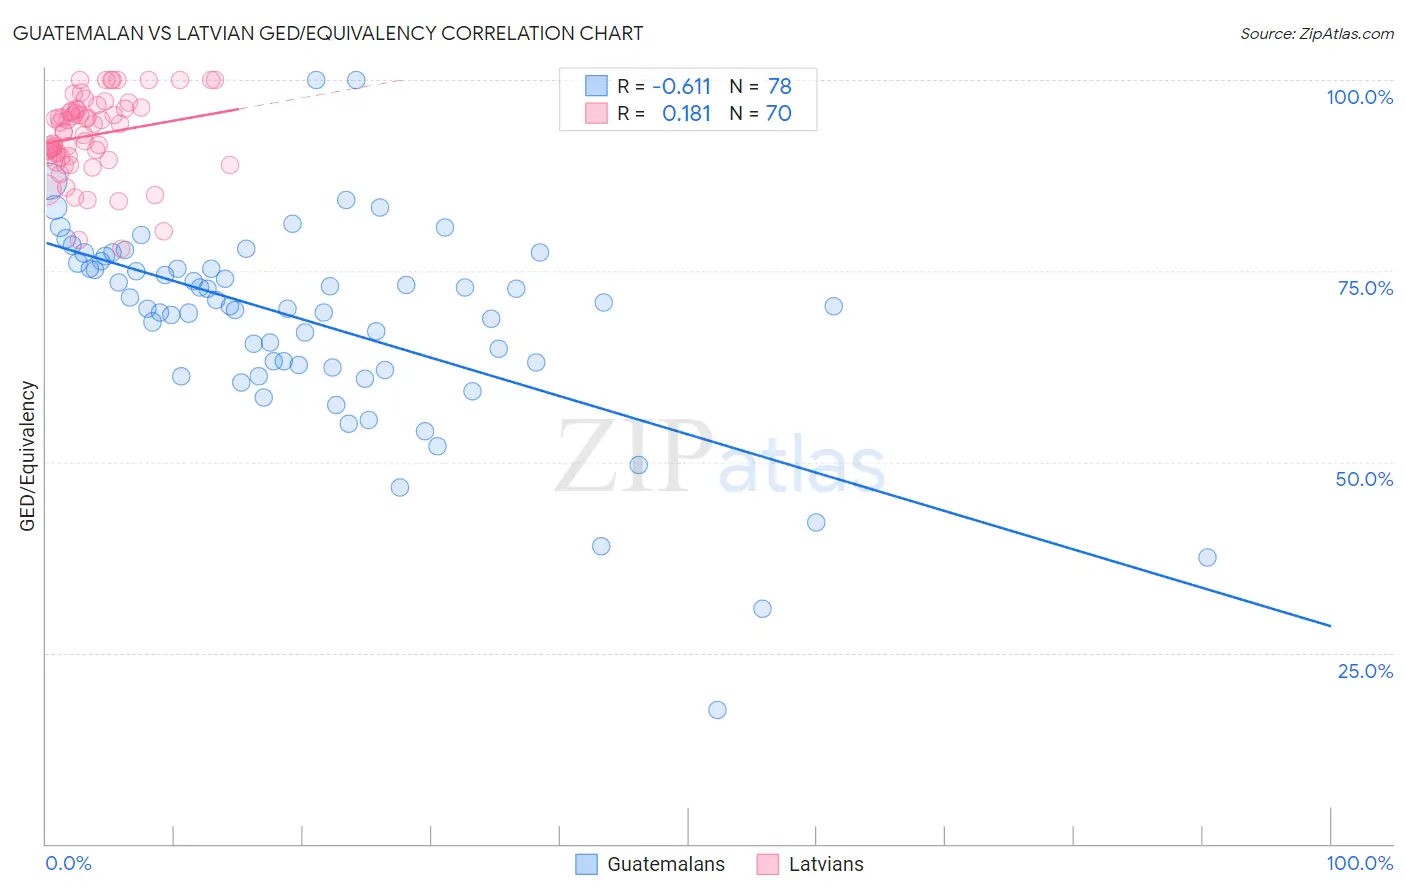
Guatemalan vs Latvian GED/Equivalency Correlation Chart
The statistical analysis conducted on geographies consisting of 409,566,541 people shows a significant negative correlation between the proportion of Guatemalans and percentage of population with at least ged/equivalency education in the United States with a correlation coefficient (R) of -0.611 and weighted average of 78.5%. Similarly, the statistical analysis conducted on geographies consisting of 220,726,693 people shows a poor positive correlation between the proportion of Latvians and percentage of population with at least ged/equivalency education in the United States with a correlation coefficient (R) of 0.181 and weighted average of 89.2%, a difference of 13.6%.
GED/Equivalency Correlation Summary
| Measurement | Guatemalan | Latvian |
| Minimum | 17.6% | 78.0% |
| Maximum | 100.0% | 100.0% |
| Range | 82.4% | 22.0% |
| Mean | 68.3% | 92.8% |
| Median | 70.4% | 93.8% |
| Interquartile 25% (IQ1) | 62.3% | 90.0% |
| Interquartile 75% (IQ3) | 76.0% | 96.2% |
| Interquartile Range (IQR) | 13.7% | 6.2% |
| Standard Deviation (Sample) | 13.4% | 5.2% |
| Standard Deviation (Population) | 13.3% | 5.2% |
Similar Demographics by GED/Equivalency
Demographics Similar to Guatemalans by GED/Equivalency
In terms of ged/equivalency, the demographic groups most similar to Guatemalans are Immigrants from Latin America (78.5%, a difference of 0.020%), Salvadoran (78.6%, a difference of 0.080%), Immigrants from the Azores (78.7%, a difference of 0.20%), Immigrants from Honduras (78.7%, a difference of 0.31%), and Immigrants from Cabo Verde (78.9%, a difference of 0.55%).
| Demographics | Rating | Rank | GED/Equivalency |
| Central Americans | 0.0 /100 | #327 | Tragic 79.2% |
| Hispanics or Latinos | 0.0 /100 | #328 | Tragic 79.1% |
| Dominicans | 0.0 /100 | #329 | Tragic 79.1% |
| Immigrants | Cabo Verde | 0.0 /100 | #330 | Tragic 78.9% |
| Immigrants | Honduras | 0.0 /100 | #331 | Tragic 78.7% |
| Immigrants | Azores | 0.0 /100 | #332 | Tragic 78.7% |
| Salvadorans | 0.0 /100 | #333 | Tragic 78.6% |
| Guatemalans | 0.0 /100 | #334 | Tragic 78.5% |
| Immigrants | Latin America | 0.0 /100 | #335 | Tragic 78.5% |
| Immigrants | Dominican Republic | 0.0 /100 | #336 | Tragic 78.0% |
| Immigrants | Yemen | 0.0 /100 | #337 | Tragic 77.9% |
| Immigrants | Guatemala | 0.0 /100 | #338 | Tragic 77.9% |
| Immigrants | El Salvador | 0.0 /100 | #339 | Tragic 77.6% |
| Tohono O'odham | 0.0 /100 | #340 | Tragic 77.5% |
| Mexicans | 0.0 /100 | #341 | Tragic 77.4% |
Demographics Similar to Latvians by GED/Equivalency
In terms of ged/equivalency, the demographic groups most similar to Latvians are Thai (89.1%, a difference of 0.020%), Eastern European (89.1%, a difference of 0.060%), Iranian (89.2%, a difference of 0.10%), Carpatho Rusyn (89.1%, a difference of 0.11%), and Chinese (89.0%, a difference of 0.13%).
| Demographics | Rating | Rank | GED/Equivalency |
| Immigrants | India | 100.0 /100 | #1 | Exceptional 89.7% |
| Filipinos | 100.0 /100 | #2 | Exceptional 89.5% |
| Immigrants | Singapore | 100.0 /100 | #3 | Exceptional 89.3% |
| Iranians | 100.0 /100 | #4 | Exceptional 89.2% |
| Latvians | 100.0 /100 | #5 | Exceptional 89.2% |
| Thais | 100.0 /100 | #6 | Exceptional 89.1% |
| Eastern Europeans | 99.9 /100 | #7 | Exceptional 89.1% |
| Carpatho Rusyns | 99.9 /100 | #8 | Exceptional 89.1% |
| Chinese | 99.9 /100 | #9 | Exceptional 89.0% |
| Norwegians | 99.9 /100 | #10 | Exceptional 89.0% |
| Bulgarians | 99.9 /100 | #11 | Exceptional 89.0% |
| Lithuanians | 99.9 /100 | #12 | Exceptional 88.9% |
| Immigrants | Iran | 99.9 /100 | #13 | Exceptional 88.9% |
| Cypriots | 99.9 /100 | #14 | Exceptional 88.9% |
| Okinawans | 99.9 /100 | #15 | Exceptional 88.9% |