Bolivian vs Immigrants from Greece GED/Equivalency
COMPARE
Bolivian
Immigrants from Greece
GED/Equivalency
GED/Equivalency Comparison
Bolivians
Immigrants from Greece
86.4%
GED/EQUIVALENCY
82.1/ 100
METRIC RATING
144th/ 347
METRIC RANK
87.4%
GED/EQUIVALENCY
97.7/ 100
METRIC RATING
95th/ 347
METRIC RANK
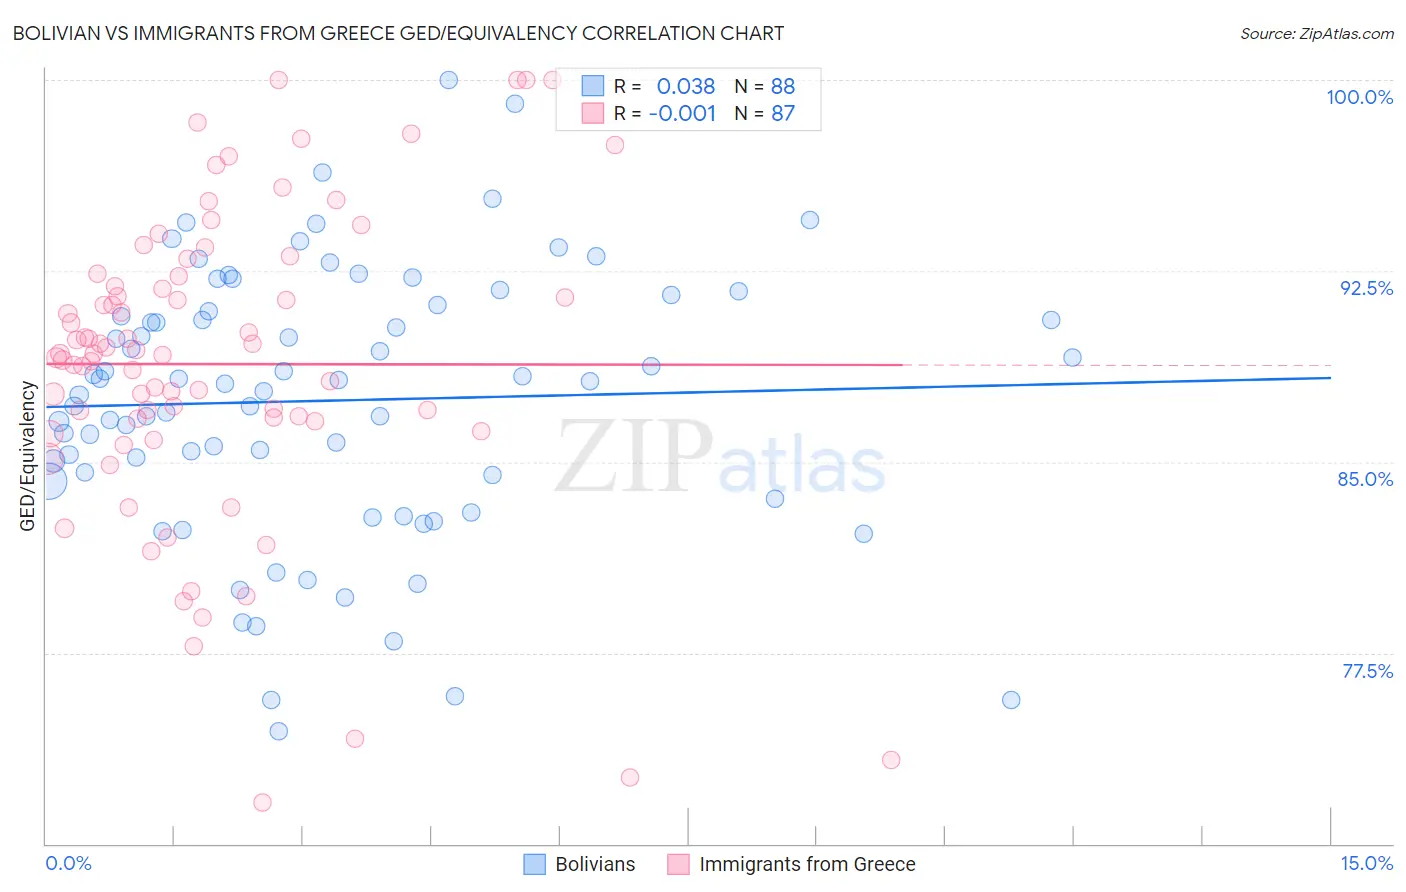
Bolivian vs Immigrants from Greece GED/Equivalency Correlation Chart
The statistical analysis conducted on geographies consisting of 184,667,452 people shows no correlation between the proportion of Bolivians and percentage of population with at least ged/equivalency education in the United States with a correlation coefficient (R) of 0.038 and weighted average of 86.4%. Similarly, the statistical analysis conducted on geographies consisting of 216,879,847 people shows no correlation between the proportion of Immigrants from Greece and percentage of population with at least ged/equivalency education in the United States with a correlation coefficient (R) of -0.001 and weighted average of 87.4%, a difference of 1.1%.
GED/Equivalency Correlation Summary
| Measurement | Bolivian | Immigrants from Greece |
| Minimum | 74.4% | 71.6% |
| Maximum | 100.0% | 100.0% |
| Range | 25.6% | 28.4% |
| Mean | 87.4% | 88.8% |
| Median | 88.1% | 89.3% |
| Interquartile 25% (IQ1) | 84.4% | 86.6% |
| Interquartile 75% (IQ3) | 91.0% | 92.3% |
| Interquartile Range (IQR) | 6.7% | 5.7% |
| Standard Deviation (Sample) | 5.3% | 6.1% |
| Standard Deviation (Population) | 5.3% | 6.1% |
Similar Demographics by GED/Equivalency
Demographics Similar to Bolivians by GED/Equivalency
In terms of ged/equivalency, the demographic groups most similar to Bolivians are Immigrants from Indonesia (86.4%, a difference of 0.010%), Immigrants from Pakistan (86.4%, a difference of 0.010%), Laotian (86.5%, a difference of 0.040%), Pakistani (86.4%, a difference of 0.060%), and Paraguayan (86.5%, a difference of 0.070%).
| Demographics | Rating | Rank | GED/Equivalency |
| Arabs | 86.7 /100 | #137 | Excellent 86.6% |
| Immigrants | Argentina | 86.5 /100 | #138 | Excellent 86.6% |
| Immigrants | Malaysia | 85.0 /100 | #139 | Excellent 86.5% |
| Paraguayans | 84.1 /100 | #140 | Excellent 86.5% |
| Laotians | 83.2 /100 | #141 | Excellent 86.5% |
| Immigrants | Indonesia | 82.4 /100 | #142 | Excellent 86.4% |
| Immigrants | Pakistan | 82.4 /100 | #143 | Excellent 86.4% |
| Bolivians | 82.1 /100 | #144 | Excellent 86.4% |
| Pakistanis | 80.4 /100 | #145 | Excellent 86.4% |
| Basques | 79.5 /100 | #146 | Good 86.4% |
| Immigrants | Northern Africa | 79.3 /100 | #147 | Good 86.3% |
| Immigrants | Poland | 79.3 /100 | #148 | Good 86.3% |
| Menominee | 79.3 /100 | #149 | Good 86.3% |
| Immigrants | Western Asia | 78.8 /100 | #150 | Good 86.3% |
| Immigrants | Bosnia and Herzegovina | 77.9 /100 | #151 | Good 86.3% |
Demographics Similar to Immigrants from Greece by GED/Equivalency
In terms of ged/equivalency, the demographic groups most similar to Immigrants from Greece are Immigrants from North Macedonia (87.4%, a difference of 0.020%), Immigrants from Russia (87.4%, a difference of 0.020%), Czechoslovakian (87.4%, a difference of 0.020%), Israeli (87.4%, a difference of 0.030%), and Immigrants from Eastern Asia (87.4%, a difference of 0.040%).
| Demographics | Rating | Rank | GED/Equivalency |
| Immigrants | Norway | 98.1 /100 | #88 | Exceptional 87.5% |
| Hungarians | 97.9 /100 | #89 | Exceptional 87.4% |
| Welsh | 97.9 /100 | #90 | Exceptional 87.4% |
| Immigrants | Eastern Asia | 97.9 /100 | #91 | Exceptional 87.4% |
| Israelis | 97.8 /100 | #92 | Exceptional 87.4% |
| Immigrants | North Macedonia | 97.8 /100 | #93 | Exceptional 87.4% |
| Immigrants | Russia | 97.8 /100 | #94 | Exceptional 87.4% |
| Immigrants | Greece | 97.7 /100 | #95 | Exceptional 87.4% |
| Czechoslovakians | 97.6 /100 | #96 | Exceptional 87.4% |
| Immigrants | Western Europe | 97.3 /100 | #97 | Exceptional 87.3% |
| Immigrants | Croatia | 96.9 /100 | #98 | Exceptional 87.3% |
| Immigrants | Belarus | 96.9 /100 | #99 | Exceptional 87.3% |
| Palestinians | 96.8 /100 | #100 | Exceptional 87.3% |
| Syrians | 96.6 /100 | #101 | Exceptional 87.2% |
| Lebanese | 96.2 /100 | #102 | Exceptional 87.2% |