Blackfeet vs Immigrants from Latvia Family Households
COMPARE
Blackfeet
Immigrants from Latvia
Family Households
Family Households Comparison
Blackfeet
Immigrants from Latvia
63.6%
FAMILY HOUSEHOLDS
3.6/ 100
METRIC RATING
228th/ 347
METRIC RANK
62.0%
FAMILY HOUSEHOLDS
0.0/ 100
METRIC RATING
312th/ 347
METRIC RANK
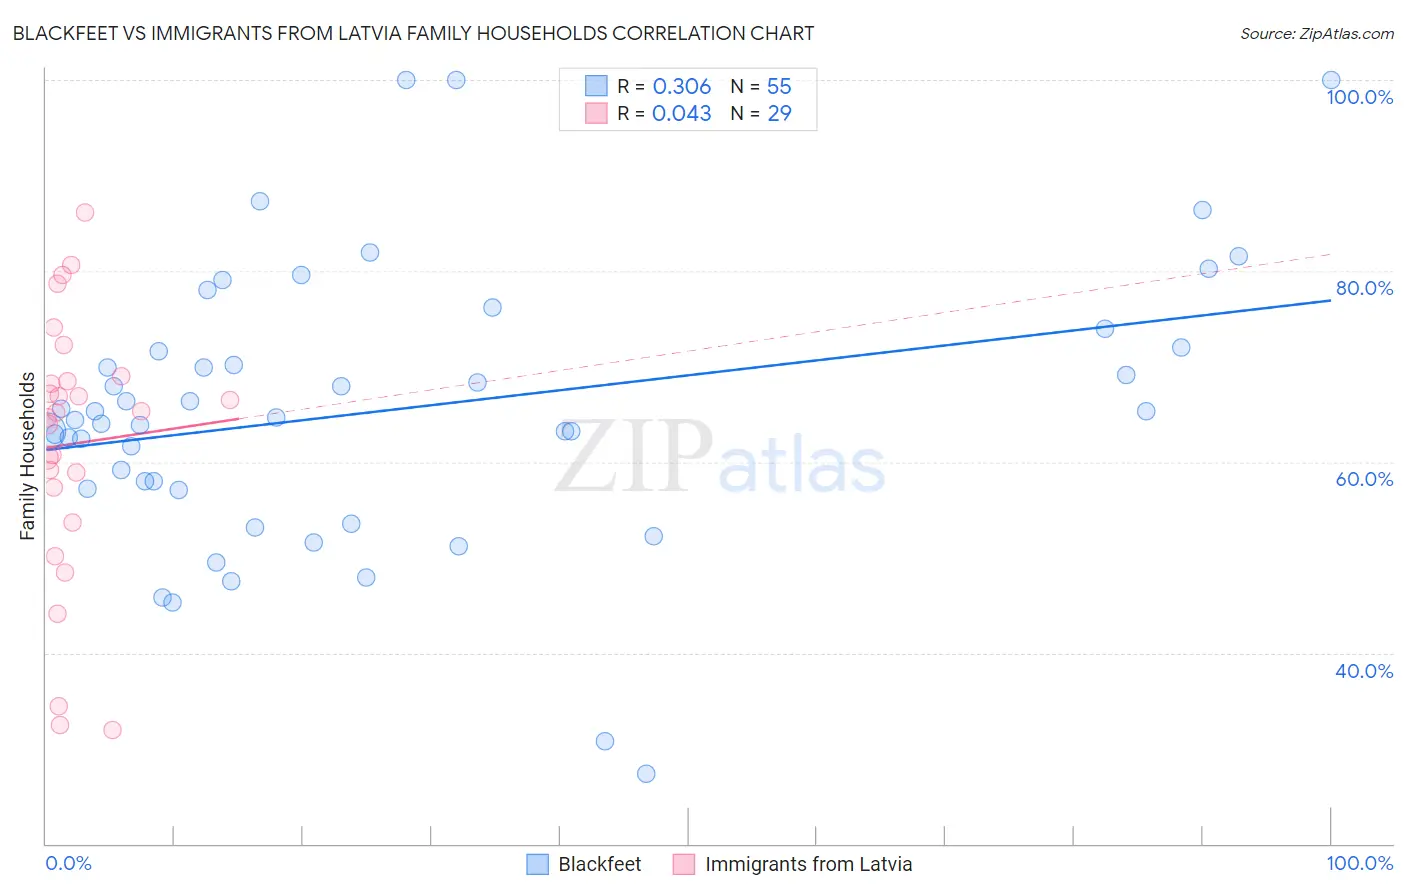
Blackfeet vs Immigrants from Latvia Family Households Correlation Chart
The statistical analysis conducted on geographies consisting of 309,476,715 people shows a mild positive correlation between the proportion of Blackfeet and percentage of family households in the United States with a correlation coefficient (R) of 0.306 and weighted average of 63.6%. Similarly, the statistical analysis conducted on geographies consisting of 113,726,313 people shows no correlation between the proportion of Immigrants from Latvia and percentage of family households in the United States with a correlation coefficient (R) of 0.043 and weighted average of 62.0%, a difference of 2.6%.
Family Households Correlation Summary
| Measurement | Blackfeet | Immigrants from Latvia |
| Minimum | 27.3% | 31.9% |
| Maximum | 100.0% | 86.2% |
| Range | 72.7% | 54.2% |
| Mean | 65.5% | 61.9% |
| Median | 64.6% | 65.2% |
| Interquartile 25% (IQ1) | 57.2% | 55.5% |
| Interquartile 75% (IQ3) | 72.0% | 68.7% |
| Interquartile Range (IQR) | 14.9% | 13.2% |
| Standard Deviation (Sample) | 14.7% | 13.8% |
| Standard Deviation (Population) | 14.6% | 13.5% |
Similar Demographics by Family Households
Demographics Similar to Blackfeet by Family Households
In terms of family households, the demographic groups most similar to Blackfeet are Bulgarian (63.6%, a difference of 0.020%), Trinidadian and Tobagonian (63.6%, a difference of 0.050%), Immigrants from Bahamas (63.6%, a difference of 0.060%), Immigrants from Brazil (63.6%, a difference of 0.060%), and Immigrants from Hungary (63.6%, a difference of 0.070%).
| Demographics | Rating | Rank | Family Households |
| Immigrants | South Africa | 5.9 /100 | #221 | Tragic 63.7% |
| Immigrants | Belarus | 5.5 /100 | #222 | Tragic 63.7% |
| French Canadians | 5.4 /100 | #223 | Tragic 63.7% |
| Turks | 4.5 /100 | #224 | Tragic 63.6% |
| Immigrants | Hungary | 4.3 /100 | #225 | Tragic 63.6% |
| Immigrants | Bahamas | 4.2 /100 | #226 | Tragic 63.6% |
| Trinidadians and Tobagonians | 4.1 /100 | #227 | Tragic 63.6% |
| Blackfeet | 3.6 /100 | #228 | Tragic 63.6% |
| Bulgarians | 3.4 /100 | #229 | Tragic 63.6% |
| Immigrants | Brazil | 3.0 /100 | #230 | Tragic 63.6% |
| Immigrants | Greece | 2.9 /100 | #231 | Tragic 63.5% |
| Immigrants | Northern Africa | 2.6 /100 | #232 | Tragic 63.5% |
| Immigrants | Armenia | 2.6 /100 | #233 | Tragic 63.5% |
| Finns | 2.3 /100 | #234 | Tragic 63.5% |
| Albanians | 2.2 /100 | #235 | Tragic 63.5% |
Demographics Similar to Immigrants from Latvia by Family Households
In terms of family households, the demographic groups most similar to Immigrants from Latvia are Liberian (62.0%, a difference of 0.010%), Immigrants from Morocco (62.0%, a difference of 0.050%), Immigrants from Cabo Verde (61.9%, a difference of 0.060%), Immigrants from Liberia (62.0%, a difference of 0.080%), and Moroccan (61.9%, a difference of 0.10%).
| Demographics | Rating | Rank | Family Households |
| Bermudans | 0.0 /100 | #305 | Tragic 62.2% |
| Africans | 0.0 /100 | #306 | Tragic 62.1% |
| Immigrants | Norway | 0.0 /100 | #307 | Tragic 62.1% |
| Chippewa | 0.0 /100 | #308 | Tragic 62.1% |
| Sub-Saharan Africans | 0.0 /100 | #309 | Tragic 62.1% |
| Immigrants | Liberia | 0.0 /100 | #310 | Tragic 62.0% |
| Immigrants | Morocco | 0.0 /100 | #311 | Tragic 62.0% |
| Immigrants | Latvia | 0.0 /100 | #312 | Tragic 62.0% |
| Liberians | 0.0 /100 | #313 | Tragic 62.0% |
| Immigrants | Cabo Verde | 0.0 /100 | #314 | Tragic 61.9% |
| Moroccans | 0.0 /100 | #315 | Tragic 61.9% |
| Immigrants | Middle Africa | 0.0 /100 | #316 | Tragic 61.9% |
| Immigrants | Bosnia and Herzegovina | 0.0 /100 | #317 | Tragic 61.9% |
| Alaskan Athabascans | 0.0 /100 | #318 | Tragic 61.8% |
| Cape Verdeans | 0.0 /100 | #319 | Tragic 61.8% |