Blackfeet vs Immigrants from China GED/Equivalency
COMPARE
Blackfeet
Immigrants from China
GED/Equivalency
GED/Equivalency Comparison
Blackfeet
Immigrants from China
83.8%
GED/EQUIVALENCY
1.1/ 100
METRIC RATING
248th/ 347
METRIC RANK
86.9%
GED/EQUIVALENCY
93.2/ 100
METRIC RATING
119th/ 347
METRIC RANK
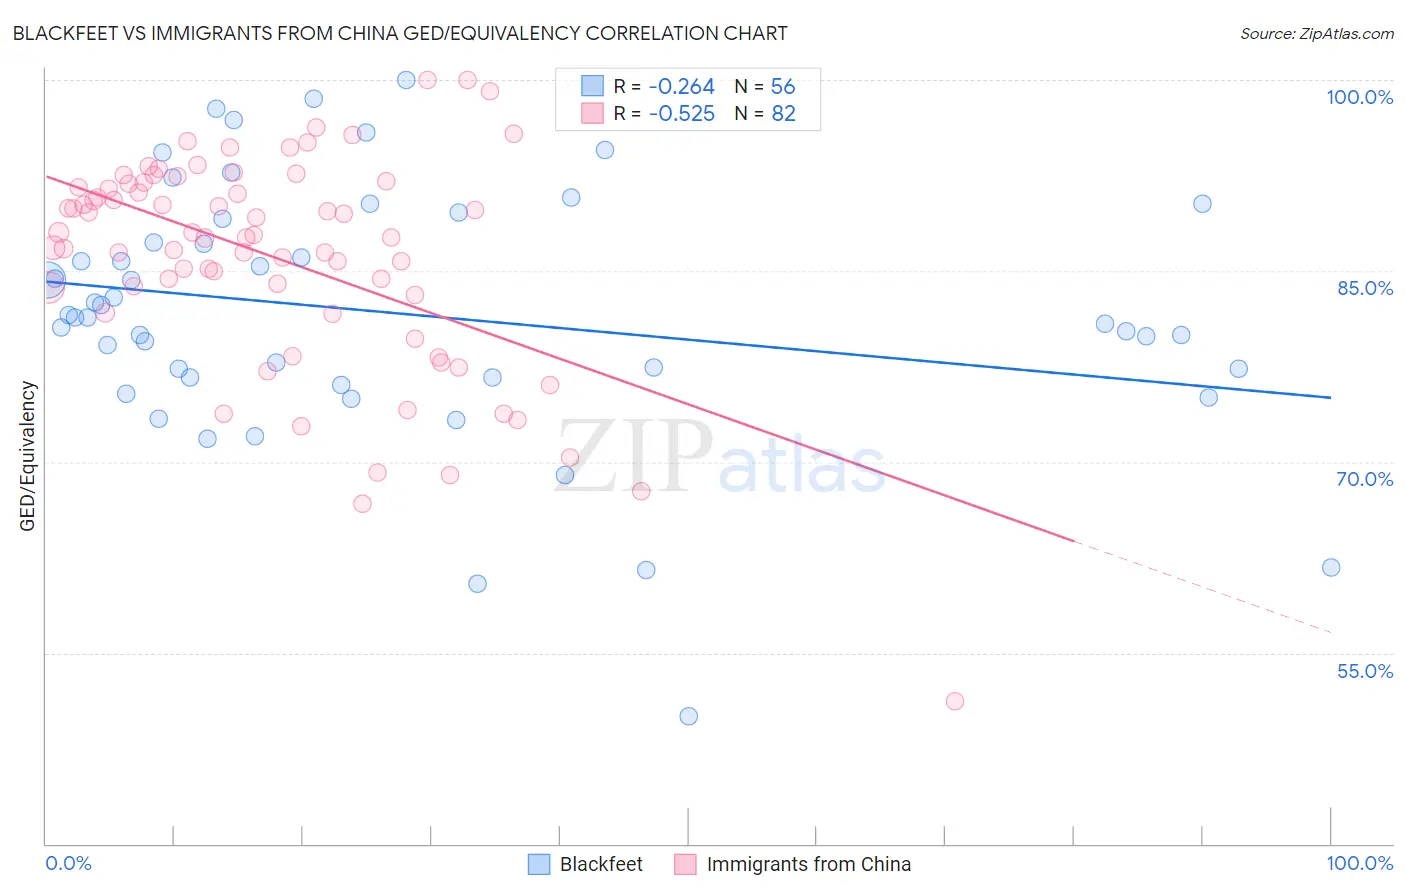
Blackfeet vs Immigrants from China GED/Equivalency Correlation Chart
The statistical analysis conducted on geographies consisting of 309,582,068 people shows a weak negative correlation between the proportion of Blackfeet and percentage of population with at least ged/equivalency education in the United States with a correlation coefficient (R) of -0.264 and weighted average of 83.8%. Similarly, the statistical analysis conducted on geographies consisting of 457,082,738 people shows a substantial negative correlation between the proportion of Immigrants from China and percentage of population with at least ged/equivalency education in the United States with a correlation coefficient (R) of -0.525 and weighted average of 86.9%, a difference of 3.7%.
GED/Equivalency Correlation Summary
| Measurement | Blackfeet | Immigrants from China |
| Minimum | 50.0% | 51.2% |
| Maximum | 100.0% | 100.0% |
| Range | 50.0% | 48.8% |
| Mean | 81.7% | 86.0% |
| Median | 81.4% | 87.7% |
| Interquartile 25% (IQ1) | 76.6% | 83.1% |
| Interquartile 75% (IQ3) | 88.2% | 91.9% |
| Interquartile Range (IQR) | 11.6% | 8.8% |
| Standard Deviation (Sample) | 9.9% | 8.6% |
| Standard Deviation (Population) | 9.8% | 8.6% |
Similar Demographics by GED/Equivalency
Demographics Similar to Blackfeet by GED/Equivalency
In terms of ged/equivalency, the demographic groups most similar to Blackfeet are Crow (83.8%, a difference of 0.010%), Immigrants from Western Africa (83.8%, a difference of 0.020%), Shoshone (83.7%, a difference of 0.020%), Chickasaw (83.8%, a difference of 0.050%), and Immigrants from Senegal (83.8%, a difference of 0.070%).
| Demographics | Rating | Rank | GED/Equivalency |
| Senegalese | 1.9 /100 | #241 | Tragic 84.0% |
| Sri Lankans | 1.9 /100 | #242 | Tragic 84.0% |
| Cherokee | 1.3 /100 | #243 | Tragic 83.9% |
| Immigrants | Ghana | 1.3 /100 | #244 | Tragic 83.9% |
| Immigrants | Senegal | 1.2 /100 | #245 | Tragic 83.8% |
| Chickasaw | 1.2 /100 | #246 | Tragic 83.8% |
| Immigrants | Western Africa | 1.1 /100 | #247 | Tragic 83.8% |
| Blackfeet | 1.1 /100 | #248 | Tragic 83.8% |
| Crow | 1.1 /100 | #249 | Tragic 83.8% |
| Shoshone | 1.0 /100 | #250 | Tragic 83.7% |
| Spanish Americans | 0.8 /100 | #251 | Tragic 83.6% |
| Bahamians | 0.8 /100 | #252 | Tragic 83.6% |
| Comanche | 0.7 /100 | #253 | Tragic 83.6% |
| Creek | 0.7 /100 | #254 | Tragic 83.6% |
| Colville | 0.5 /100 | #255 | Tragic 83.4% |
Demographics Similar to Immigrants from China by GED/Equivalency
In terms of ged/equivalency, the demographic groups most similar to Immigrants from China are French Canadian (86.9%, a difference of 0.0%), Immigrants from Hong Kong (86.9%, a difference of 0.050%), Swiss (87.0%, a difference of 0.12%), Scotch-Irish (86.8%, a difference of 0.12%), and Immigrants from Kazakhstan (87.0%, a difference of 0.13%).
| Demographics | Rating | Rank | GED/Equivalency |
| Tlingit-Haida | 94.8 /100 | #112 | Exceptional 87.0% |
| Assyrians/Chaldeans/Syriacs | 94.8 /100 | #113 | Exceptional 87.0% |
| Immigrants | Kazakhstan | 94.7 /100 | #114 | Exceptional 87.0% |
| Mongolians | 94.6 /100 | #115 | Exceptional 87.0% |
| Swiss | 94.5 /100 | #116 | Exceptional 87.0% |
| Immigrants | Hong Kong | 93.8 /100 | #117 | Exceptional 86.9% |
| French Canadians | 93.2 /100 | #118 | Exceptional 86.9% |
| Immigrants | China | 93.2 /100 | #119 | Exceptional 86.9% |
| Scotch-Irish | 91.6 /100 | #120 | Exceptional 86.8% |
| Immigrants | Lebanon | 90.9 /100 | #121 | Exceptional 86.8% |
| Immigrants | Jordan | 90.8 /100 | #122 | Exceptional 86.8% |
| Immigrants | Italy | 90.5 /100 | #123 | Exceptional 86.7% |
| Immigrants | Egypt | 90.4 /100 | #124 | Exceptional 86.7% |
| Celtics | 90.4 /100 | #125 | Exceptional 86.7% |
| Asians | 90.3 /100 | #126 | Exceptional 86.7% |