Blackfeet vs Houma GED/Equivalency
COMPARE
Blackfeet
Houma
GED/Equivalency
GED/Equivalency Comparison
Blackfeet
Houma
83.8%
GED/EQUIVALENCY
1.1/ 100
METRIC RATING
248th/ 347
METRIC RANK
75.0%
GED/EQUIVALENCY
0.0/ 100
METRIC RATING
346th/ 347
METRIC RANK
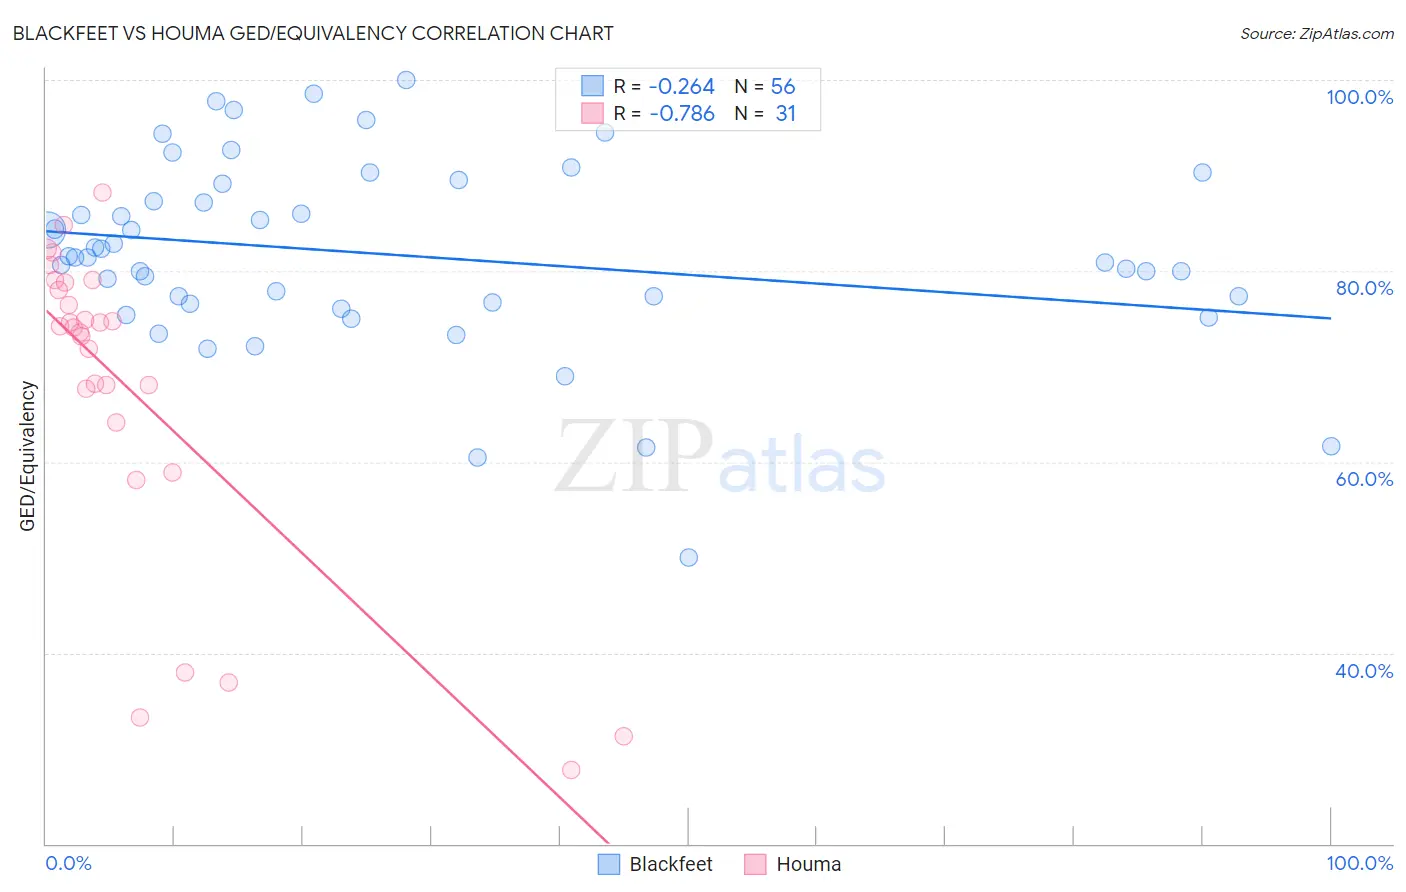
Blackfeet vs Houma GED/Equivalency Correlation Chart
The statistical analysis conducted on geographies consisting of 309,582,068 people shows a weak negative correlation between the proportion of Blackfeet and percentage of population with at least ged/equivalency education in the United States with a correlation coefficient (R) of -0.264 and weighted average of 83.8%. Similarly, the statistical analysis conducted on geographies consisting of 36,795,916 people shows a strong negative correlation between the proportion of Houma and percentage of population with at least ged/equivalency education in the United States with a correlation coefficient (R) of -0.786 and weighted average of 75.0%, a difference of 11.7%.
GED/Equivalency Correlation Summary
| Measurement | Blackfeet | Houma |
| Minimum | 50.0% | 27.8% |
| Maximum | 100.0% | 88.2% |
| Range | 50.0% | 60.4% |
| Mean | 81.7% | 67.6% |
| Median | 81.4% | 74.1% |
| Interquartile 25% (IQ1) | 76.6% | 64.2% |
| Interquartile 75% (IQ3) | 88.2% | 78.8% |
| Interquartile Range (IQR) | 11.6% | 14.6% |
| Standard Deviation (Sample) | 9.9% | 16.7% |
| Standard Deviation (Population) | 9.8% | 16.4% |
Similar Demographics by GED/Equivalency
Demographics Similar to Blackfeet by GED/Equivalency
In terms of ged/equivalency, the demographic groups most similar to Blackfeet are Crow (83.8%, a difference of 0.010%), Immigrants from Western Africa (83.8%, a difference of 0.020%), Shoshone (83.7%, a difference of 0.020%), Chickasaw (83.8%, a difference of 0.050%), and Immigrants from Senegal (83.8%, a difference of 0.070%).
| Demographics | Rating | Rank | GED/Equivalency |
| Senegalese | 1.9 /100 | #241 | Tragic 84.0% |
| Sri Lankans | 1.9 /100 | #242 | Tragic 84.0% |
| Cherokee | 1.3 /100 | #243 | Tragic 83.9% |
| Immigrants | Ghana | 1.3 /100 | #244 | Tragic 83.9% |
| Immigrants | Senegal | 1.2 /100 | #245 | Tragic 83.8% |
| Chickasaw | 1.2 /100 | #246 | Tragic 83.8% |
| Immigrants | Western Africa | 1.1 /100 | #247 | Tragic 83.8% |
| Blackfeet | 1.1 /100 | #248 | Tragic 83.8% |
| Crow | 1.1 /100 | #249 | Tragic 83.8% |
| Shoshone | 1.0 /100 | #250 | Tragic 83.7% |
| Spanish Americans | 0.8 /100 | #251 | Tragic 83.6% |
| Bahamians | 0.8 /100 | #252 | Tragic 83.6% |
| Comanche | 0.7 /100 | #253 | Tragic 83.6% |
| Creek | 0.7 /100 | #254 | Tragic 83.6% |
| Colville | 0.5 /100 | #255 | Tragic 83.4% |
Demographics Similar to Houma by GED/Equivalency
In terms of ged/equivalency, the demographic groups most similar to Houma are Yakama (74.5%, a difference of 0.61%), Immigrants from Mexico (75.7%, a difference of 0.94%), Spanish American Indian (76.3%, a difference of 1.8%), Immigrants from Central America (76.4%, a difference of 1.9%), and Pima (76.4%, a difference of 2.0%).
| Demographics | Rating | Rank | GED/Equivalency |
| Salvadorans | 0.0 /100 | #333 | Tragic 78.6% |
| Guatemalans | 0.0 /100 | #334 | Tragic 78.5% |
| Immigrants | Latin America | 0.0 /100 | #335 | Tragic 78.5% |
| Immigrants | Dominican Republic | 0.0 /100 | #336 | Tragic 78.0% |
| Immigrants | Yemen | 0.0 /100 | #337 | Tragic 77.9% |
| Immigrants | Guatemala | 0.0 /100 | #338 | Tragic 77.9% |
| Immigrants | El Salvador | 0.0 /100 | #339 | Tragic 77.6% |
| Tohono O'odham | 0.0 /100 | #340 | Tragic 77.5% |
| Mexicans | 0.0 /100 | #341 | Tragic 77.4% |
| Pima | 0.0 /100 | #342 | Tragic 76.4% |
| Immigrants | Central America | 0.0 /100 | #343 | Tragic 76.4% |
| Spanish American Indians | 0.0 /100 | #344 | Tragic 76.3% |
| Immigrants | Mexico | 0.0 /100 | #345 | Tragic 75.7% |
| Houma | 0.0 /100 | #346 | Tragic 75.0% |
| Yakama | 0.0 /100 | #347 | Tragic 74.5% |