Yugoslavian vs Immigrants from Cuba Bachelor's Degree
COMPARE
Yugoslavian
Immigrants from Cuba
Bachelor's Degree
Bachelor's Degree Comparison
Yugoslavians
Immigrants from Cuba
37.1%
BACHELOR'S DEGREE
31.5/ 100
METRIC RATING
193rd/ 347
METRIC RANK
30.3%
BACHELOR'S DEGREE
0.0/ 100
METRIC RATING
301st/ 347
METRIC RANK
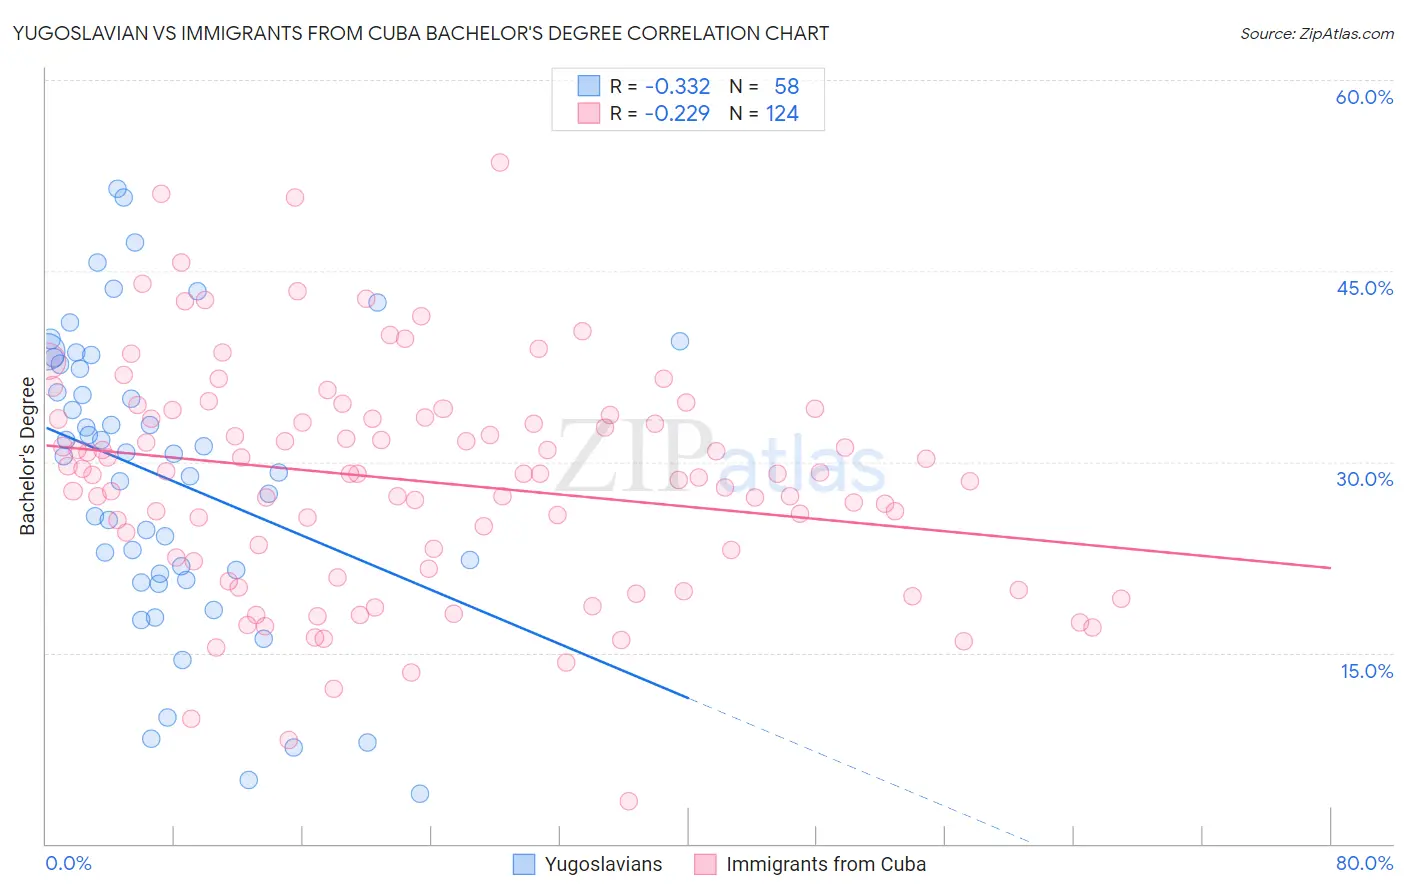
Yugoslavian vs Immigrants from Cuba Bachelor's Degree Correlation Chart
The statistical analysis conducted on geographies consisting of 285,712,263 people shows a mild negative correlation between the proportion of Yugoslavians and percentage of population with at least bachelor's degree education in the United States with a correlation coefficient (R) of -0.332 and weighted average of 37.1%. Similarly, the statistical analysis conducted on geographies consisting of 325,960,947 people shows a weak negative correlation between the proportion of Immigrants from Cuba and percentage of population with at least bachelor's degree education in the United States with a correlation coefficient (R) of -0.229 and weighted average of 30.3%, a difference of 22.4%.
Bachelor's Degree Correlation Summary
| Measurement | Yugoslavian | Immigrants from Cuba |
| Minimum | 3.9% | 3.3% |
| Maximum | 51.4% | 53.5% |
| Range | 47.5% | 50.2% |
| Mean | 28.7% | 28.5% |
| Median | 30.6% | 29.1% |
| Interquartile 25% (IQ1) | 21.2% | 22.3% |
| Interquartile 75% (IQ3) | 37.7% | 33.4% |
| Interquartile Range (IQR) | 16.5% | 11.1% |
| Standard Deviation (Sample) | 11.5% | 8.9% |
| Standard Deviation (Population) | 11.4% | 8.9% |
Similar Demographics by Bachelor's Degree
Demographics Similar to Yugoslavians by Bachelor's Degree
In terms of bachelor's degree, the demographic groups most similar to Yugoslavians are Immigrants from Vietnam (37.1%, a difference of 0.060%), Belgian (37.0%, a difference of 0.19%), Korean (37.0%, a difference of 0.20%), Celtic (37.0%, a difference of 0.23%), and Nigerian (37.2%, a difference of 0.27%).
| Demographics | Rating | Rank | Bachelor's Degree |
| Norwegians | 40.4 /100 | #186 | Average 37.5% |
| English | 39.7 /100 | #187 | Fair 37.4% |
| Immigrants | Oceania | 37.3 /100 | #188 | Fair 37.3% |
| Slovaks | 36.9 /100 | #189 | Fair 37.3% |
| Swiss | 34.1 /100 | #190 | Fair 37.2% |
| Nigerians | 33.9 /100 | #191 | Fair 37.2% |
| Immigrants | Vietnam | 32.1 /100 | #192 | Fair 37.1% |
| Yugoslavians | 31.5 /100 | #193 | Fair 37.1% |
| Belgians | 29.9 /100 | #194 | Fair 37.0% |
| Koreans | 29.8 /100 | #195 | Fair 37.0% |
| Celtics | 29.5 /100 | #196 | Fair 37.0% |
| Czechoslovakians | 29.2 /100 | #197 | Fair 37.0% |
| Welsh | 29.1 /100 | #198 | Fair 37.0% |
| Immigrants | Costa Rica | 27.4 /100 | #199 | Fair 36.9% |
| Immigrants | Ghana | 27.4 /100 | #200 | Fair 36.9% |
Demographics Similar to Immigrants from Cuba by Bachelor's Degree
In terms of bachelor's degree, the demographic groups most similar to Immigrants from Cuba are Immigrants from Micronesia (30.4%, a difference of 0.22%), Chickasaw (30.4%, a difference of 0.23%), Mexican American Indian (30.2%, a difference of 0.28%), Bangladeshi (30.2%, a difference of 0.45%), and Cherokee (30.2%, a difference of 0.45%).
| Demographics | Rating | Rank | Bachelor's Degree |
| Immigrants | Guatemala | 0.0 /100 | #294 | Tragic 30.8% |
| Immigrants | Dominican Republic | 0.0 /100 | #295 | Tragic 30.7% |
| Puget Sound Salish | 0.0 /100 | #296 | Tragic 30.7% |
| Immigrants | Haiti | 0.0 /100 | #297 | Tragic 30.6% |
| Chippewa | 0.0 /100 | #298 | Tragic 30.6% |
| Chickasaw | 0.0 /100 | #299 | Tragic 30.4% |
| Immigrants | Micronesia | 0.0 /100 | #300 | Tragic 30.4% |
| Immigrants | Cuba | 0.0 /100 | #301 | Tragic 30.3% |
| Mexican American Indians | 0.0 /100 | #302 | Tragic 30.2% |
| Bangladeshis | 0.0 /100 | #303 | Tragic 30.2% |
| Cherokee | 0.0 /100 | #304 | Tragic 30.2% |
| Immigrants | Latin America | 0.0 /100 | #305 | Tragic 30.1% |
| Immigrants | Yemen | 0.0 /100 | #306 | Tragic 29.9% |
| Nepalese | 0.0 /100 | #307 | Tragic 29.9% |
| Cajuns | 0.0 /100 | #308 | Tragic 29.6% |