Mongolian vs Immigrants from Cuba Bachelor's Degree
COMPARE
Mongolian
Immigrants from Cuba
Bachelor's Degree
Bachelor's Degree Comparison
Mongolians
Immigrants from Cuba
45.4%
BACHELOR'S DEGREE
100.0/ 100
METRIC RATING
36th/ 347
METRIC RANK
30.3%
BACHELOR'S DEGREE
0.0/ 100
METRIC RATING
301st/ 347
METRIC RANK
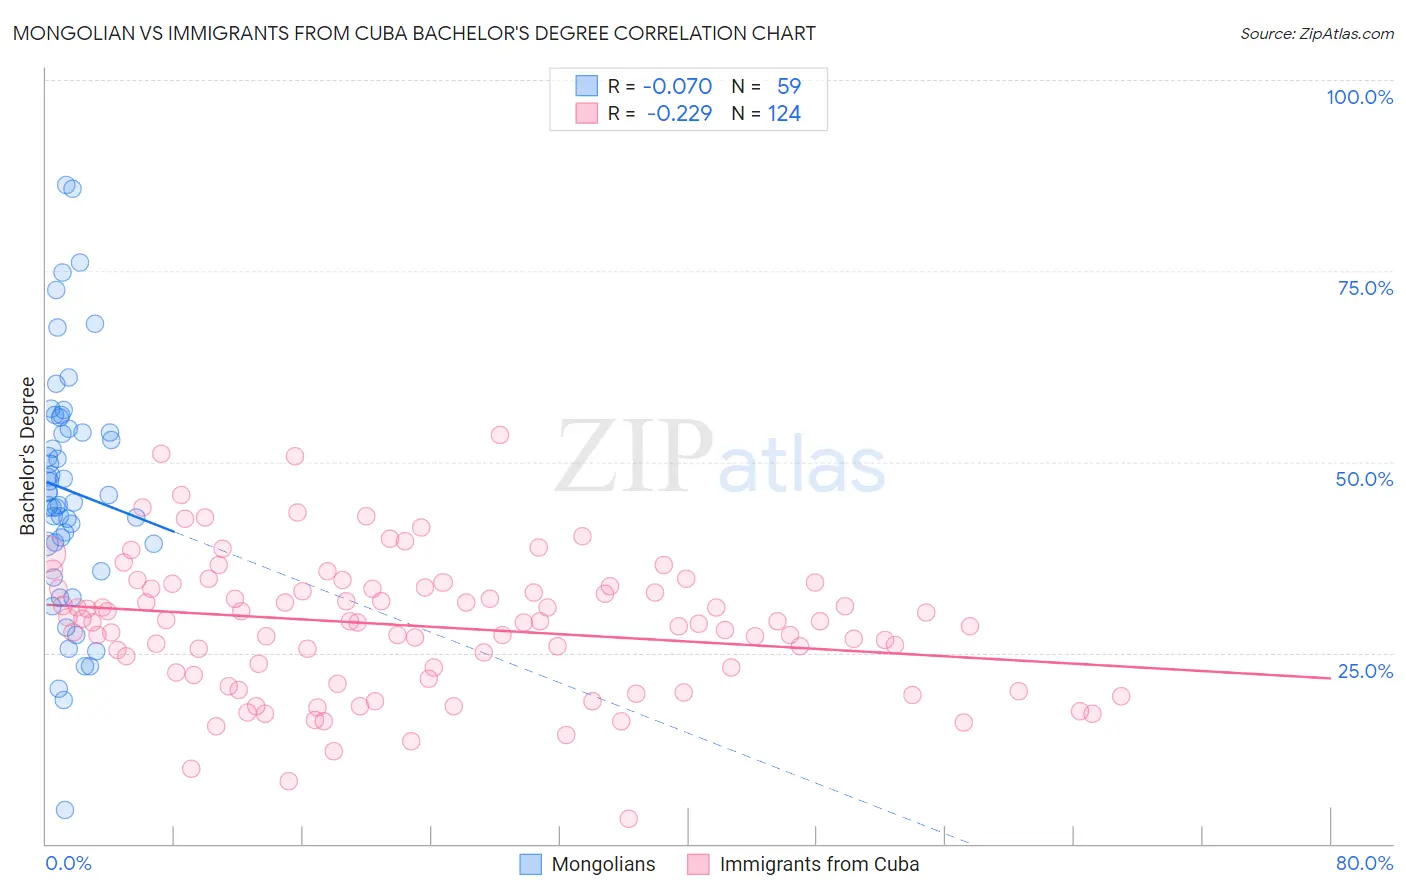
Mongolian vs Immigrants from Cuba Bachelor's Degree Correlation Chart
The statistical analysis conducted on geographies consisting of 140,357,131 people shows a slight negative correlation between the proportion of Mongolians and percentage of population with at least bachelor's degree education in the United States with a correlation coefficient (R) of -0.070 and weighted average of 45.4%. Similarly, the statistical analysis conducted on geographies consisting of 325,960,947 people shows a weak negative correlation between the proportion of Immigrants from Cuba and percentage of population with at least bachelor's degree education in the United States with a correlation coefficient (R) of -0.229 and weighted average of 30.3%, a difference of 49.7%.
Bachelor's Degree Correlation Summary
| Measurement | Mongolian | Immigrants from Cuba |
| Minimum | 4.5% | 3.3% |
| Maximum | 86.2% | 53.5% |
| Range | 81.7% | 50.2% |
| Mean | 46.3% | 28.5% |
| Median | 45.7% | 29.1% |
| Interquartile 25% (IQ1) | 39.2% | 22.3% |
| Interquartile 75% (IQ3) | 54.3% | 33.4% |
| Interquartile Range (IQR) | 15.0% | 11.1% |
| Standard Deviation (Sample) | 15.9% | 8.9% |
| Standard Deviation (Population) | 15.8% | 8.9% |
Similar Demographics by Bachelor's Degree
Demographics Similar to Mongolians by Bachelor's Degree
In terms of bachelor's degree, the demographic groups most similar to Mongolians are Immigrants from Russia (45.4%, a difference of 0.020%), Immigrants from Denmark (45.4%, a difference of 0.040%), Russian (45.3%, a difference of 0.15%), Bulgarian (45.3%, a difference of 0.24%), and Immigrants from Northern Europe (45.6%, a difference of 0.50%).
| Demographics | Rating | Rank | Bachelor's Degree |
| Israelis | 100.0 /100 | #29 | Exceptional 46.1% |
| Immigrants | Sri Lanka | 100.0 /100 | #30 | Exceptional 46.1% |
| Latvians | 100.0 /100 | #31 | Exceptional 46.1% |
| Immigrants | Turkey | 100.0 /100 | #32 | Exceptional 46.0% |
| Immigrants | Northern Europe | 100.0 /100 | #33 | Exceptional 45.6% |
| Immigrants | Denmark | 100.0 /100 | #34 | Exceptional 45.4% |
| Immigrants | Russia | 100.0 /100 | #35 | Exceptional 45.4% |
| Mongolians | 100.0 /100 | #36 | Exceptional 45.4% |
| Russians | 100.0 /100 | #37 | Exceptional 45.3% |
| Bulgarians | 100.0 /100 | #38 | Exceptional 45.3% |
| Immigrants | Latvia | 100.0 /100 | #39 | Exceptional 45.1% |
| Immigrants | Belarus | 100.0 /100 | #40 | Exceptional 45.0% |
| Immigrants | Malaysia | 100.0 /100 | #41 | Exceptional 45.0% |
| Immigrants | Saudi Arabia | 100.0 /100 | #42 | Exceptional 44.8% |
| Immigrants | South Africa | 99.9 /100 | #43 | Exceptional 44.8% |
Demographics Similar to Immigrants from Cuba by Bachelor's Degree
In terms of bachelor's degree, the demographic groups most similar to Immigrants from Cuba are Immigrants from Micronesia (30.4%, a difference of 0.22%), Chickasaw (30.4%, a difference of 0.23%), Mexican American Indian (30.2%, a difference of 0.28%), Bangladeshi (30.2%, a difference of 0.45%), and Cherokee (30.2%, a difference of 0.45%).
| Demographics | Rating | Rank | Bachelor's Degree |
| Immigrants | Guatemala | 0.0 /100 | #294 | Tragic 30.8% |
| Immigrants | Dominican Republic | 0.0 /100 | #295 | Tragic 30.7% |
| Puget Sound Salish | 0.0 /100 | #296 | Tragic 30.7% |
| Immigrants | Haiti | 0.0 /100 | #297 | Tragic 30.6% |
| Chippewa | 0.0 /100 | #298 | Tragic 30.6% |
| Chickasaw | 0.0 /100 | #299 | Tragic 30.4% |
| Immigrants | Micronesia | 0.0 /100 | #300 | Tragic 30.4% |
| Immigrants | Cuba | 0.0 /100 | #301 | Tragic 30.3% |
| Mexican American Indians | 0.0 /100 | #302 | Tragic 30.2% |
| Bangladeshis | 0.0 /100 | #303 | Tragic 30.2% |
| Cherokee | 0.0 /100 | #304 | Tragic 30.2% |
| Immigrants | Latin America | 0.0 /100 | #305 | Tragic 30.1% |
| Immigrants | Yemen | 0.0 /100 | #306 | Tragic 29.9% |
| Nepalese | 0.0 /100 | #307 | Tragic 29.9% |
| Cajuns | 0.0 /100 | #308 | Tragic 29.6% |